OFFICE OF THE LEGISLATIVE AUDITOR
STATE OF MINNESOTA
EVALUATION REPORT
Special Education
MARCH 2013
PROGRAM EVALUATION DIVISION
Centennial Building – Suite 140
658 Cedar Street – St. Paul, MN 55155
Telephone: 651-296-4708 ● Fax: 651-296-4712
E-mail: auditor@state.mn.us ● Web Site: http://www.auditor.leg.state.mn.us
Through Minnesota Relay: 1-800-627-3529 or 7-1-1
Program Evaluation Division
The Program Evaluation Division was created within the Office of the Legislative Auditor (OLA) in 1975. The division’s mission, as set forth in law, is to determine the degree to which state agencies and programs are accomplishing their goals and objectives and utilizing resources efficiently.
Topics for evaluations are approved by the Legislative Audit
Commission (LAC), which has equal representation from the House and Senate
and the two major political parties. However, evaluations by the office
are independently researched by the Legislative Auditor’s professional staff,
and reports are issued without prior review by the commission or any other
legislators. Findings, conclusions, and recommendations do not
necessarily reflect the views of the LAC or any of its members.
A list of recent evaluations is on the last page of this report. A more complete list is available at OLA's web site (www.auditor.leg.state.mn.us), as are copies of evaluation reports.
The Office of the Legislative Auditor also includes a Financial Audit Division, which annually conducts an audit of the state’s financial statements, an audit of federal funds administered by the state, and approximately 40 audits of individual state agencies, boards, and commissions. The division also investigates allegations of improper actions by state officials and employees.
Evaluation Staff
James Nobles, Legislative Auditor
Joel Alter
Valerie Bombach
Sarah Delacueva
Jody Hauer
David Kirchner
Carrie Meyerhoff
Judy Randall
Jodi Munson Rodriguez
Matt Schroeder
KJ Starr
Julie Trupke-Bastidas
Jo Vos
Lang (Kate) Yang
To obtain a copy of this document in an accessible format (electronic ASCII text, Braille, large print, or audio), please call 651-296-4708. People with hearing or speech disabilities may call us through Minnesota Relay by dialing 7-1-1 or 1-800-627-3529.
All OLA reports are available at our Web site: http://www.auditor.leg.state.mn.us.
If you have comments about our work, or you want to suggest an audit, investigation, or evaluation, please contact us at 651-296-4708 or by e-mail at auditor@state.mn.us.
|
Printed on Recycled Paper
Office of the Legislative Auditor
STATE OF MINNESOTA • James Nobles, Legislative Auditor
March 2013
Members of the Legislative Audit Commission:
The number of students receiving special education has been growing at a time when the overall number of K-12 students statewide has decreased. The proportion of all public school students receiving special education rose from 11.9 percent in the 1999-2000 school year to 13.6 percent in 2010-2011. Costs of special education have also increased during this period. In fiscal year 2011, school districts spent nearly $1.1 billion of state revenues dedicated to special education. This was a 22-percent increase in inflation-adjusted dollars since fiscal year 2000. In response to increasing costs of special education, you asked the Office of the Legislative Auditor to evaluate special education in the state.
We concluded that the funding arrangements for special education contain disincentives for controlling spending. We also found that school districts have had to divert revenues from general education aid and local operating levies to pay special education costs. In addition, we examined legal requirements that pertain to special education and identified state statutes and rules that exceed federal requirements. We concluded that analyses of the costs and educational benefits of requirements specific to Minnesota are not available. Our report explains trends in the characteristics of students who receive special education as well as special education spending. It highlights the need for additional cost controls and calls for independent analyses of potential changes to Minnesota’s requirements for special education.
Our evaluation was conducted by Jody Hauer (project manager), Sarah Roberts Delacueva, and Jodi Munson Rodriguez. The Minnesota Department of Education, local education officials, and others interested in special education cooperated with our evaluation, and we thank them for their assistance.
Sincerely,
James Nobles
Legislative Auditor
Table of Contents
Page
SUMMARY ix
INTRODUCTION 1
1. Background 5
Special Education Defined 5
Federal Legal Requirements 6
Special Education in Minnesota 10
2. Students RECEIVING Special Education 17
Students Receiving Special Education 17
Primary Disability Categories 19
Characteristics of Students Receiving Special Education 22
Instructional Settings 30
Success of Students Receiving Special Education 33
Cost Implications of Student Characteristics 40
3. Funding and COST DRIVERS 43
Funding 43
Cost Drivers and Incentives 61
4. Compliance 71
Assuring Compliance 71
Resolving Disputes 79
Federal Compliance Monitoring 82
5. Legal Requirements 87
Requirements Specific to Minnesota 88
Practical Effects of Minnesota Requirements 95
Outdated Administrative Rules 104
list of recommendations 107
APPENDIX A: Case Studies of Local Education Agencies 109
APPENDIX B: Minnesota Legal Requirements 121
agency response 135
recent program evaluations 139
List of Exhibits
Page
1. BACKGROUND
1.1 Federal Performance Indicators, 2012 9
1.2 Minnesota Department of Education Resources Related to
Special Education, Fiscal Years 2000-2011 11
2. Students RECEIVING Special Education
2.1 Student Enrollment Numbers, 1999-2000 through 2010-2011 18
2.2 Minnesota Special Education Disability Categories, 2012 20
2.3 Students Receiving Special
Education by Primary Disability
Category, 1999‑2000 and 2010-2011 21
2.4 Student Demographic Characteristics, 1999-2000 and
2010-2011 23
2.5 Grade Level of Students Receiving Special Education,
2010-2011 24
2.6 Grade Level at Which Students First Received Special
Education, 2001-2002 through 2010-2011 26
2.7 Disability Category Placements by Grade Level at Which
Students First Received Special Education, 2001-2002
through 2010-2011 27
2.8 Percentages of Students Belonging to Racial and Ethnic
Groups, 1999‑2000 and 2010-2011 28
2.9 Statewide Enrollment Rates of Racial and Ethnic Groups in
Special Education, by Primary Disability Category,
2010-2011 29
2.10 Special Education Instructional Settings 31
2.11 Students Receiving Special Education by
Instructional Setting,
1999-2000
and 2010-2011
32
2.12 Students Receiving Special Education Who Moved to a Less
Restrictive Setting, 1999-2000 through 2009-2010 36
2.13 Graduation Rates for Students Receiving
Special Education,
2004-2005 through
2009-2010
38
2.14 Drop-Out Rates for Students Receiving
Special Education,
2004-2005
through 2009-2010
39
3. Funding and COST DRIVERS
3.1 Components of School Districts’ Regular Special Education
Revenue, 2012 44
3.2 Revenues for Special
Education by Source, Fiscal Years
2000-2012
46
3.3 Minnesota Department of
Education’s Calculations of Cross
Subsidies for Special
Education
48
3.4 Sum of School District Cross Subsidies, Fiscal Years
2000-2011 50
3.5 Largest School District Cross Subsidies, Fiscal Year 2011 51
3.6 School District Cross Subsidies by Community Size and
Location, Fiscal Year 2011 52
3.7 Expenditures of Special Education Revenues by Funding
Source (Adjusted for Inflation), Fiscal Years 2000-2011 54
Page
3.8 Spending on Top Ten Types of Special Education
Expenditures, Fiscal Year 2009 56
3.9 Special Education Expenditures by Primary Disability
Category, Fiscal Year 2009 57
3.10 Estimated Spending and Extra Costs per
Student Receiving
Special Education for School Districts and Charter Schools,
Fiscal Year
2007
59
3.11 Full-Time-Equivalent Staff in Special Education, Fiscal Years
2000‑2011 62
3.12 Full-Time-Equivalent Special Education Staff by Personnel
Type, Fiscal Year 2011 63
4. Compliance
4.1 Compliance Items in the
Minnesota Department of Education’s
Three Tiers of Fiscal Monitoring, Fiscal Year
2011
74
4.2 Numbers of Complaints and Alternative Dispute Resolution,
Fiscal Years 2002-2012 81
4.3 Federal Compliance Indicators, Targets, and Results,
2010-2011 85
5. Legal Requirements
5.1 Special Education Committees Required by Minnesota
Law, 2012 91
5.2 Number of Students that May Be Assigned to a Special
Education Teacher, 2012 92
APPENDIX a: case studIES OF LOCAL EDUCATION AGENCIES
A.1 Local Education Agencies Selected as Case Studies, 2012 110
APPENDIX B: MINNESOTA LEGAL REQUIREMENTS
B.1 Documentation Requirements Specific to Minnesota, 2012 123
B.2 Committee Requirements Specific to Minnesota, 2012 125
B.3 Staffing Requirements Specific to Minnesota, 2012 126
B.4 Dispute Resolution Requirements Specific to Minnesota, 2012 126
B.5 Meeting Requirements Specific to Minnesota, 2012 128
B.6 Timelines Specific to Minnesota, 2012 129
B.7 Miscellaneous Professional
Responsibilities Specific to
Minnesota,
2012
131
B.8 Student Eligibility and Services
Requirements Specific to
Minnesota,
2012
133
Summary
Key Facts and Findings:
· Many Minnesota statutes and rules exceed federal requirements for special education, but detailed analyses of the requirements’ educational and cost impacts are not available.
· School districts have had to divert revenues from general education aid and local operating levies to pay special education costs. Median sources of revenue for special education over fiscal years 2000 to 2011 were: 56 percent from state special education revenues, 33 percent from school districts’ general education and locally raised revenues, and 11 percent from federal revenues.
· School districts pay the costs of special education when one of their resident students enrolls elsewhere, but resident districts have little control over those costs.
· The Minnesota Department of Education (MDE) has a process to ensure school district compliance with federal and state requirements, but district representatives have voiced confusion about the process.
· The number of students receiving special education increased 11 percent from fiscal year 2000 to 2011, while the overall number of K-12 students statewide decreased. Over that time, full-time-equivalent special education staff increased about 25 percent.
· Several state rules on special education are inconsistent with Minnesota statutes.
[Sidebar]
Changes are needed in special education to increase equity in its funding, help control costs while meeting student needs, and ensure local education agencies’ compliance with legal requirements without creating undue workload burdens for them.
[End of Sidebar]
Key Recommendations:
· The Legislature should consider options to reduce school district reliance on general education funding to pay special education expenses. At the same time, MDE should work with school districts to identify feasible cost controls in special education.
· The Legislature should direct MDE to initiate independent analyses of the economic and educational impacts of potential changes to state regulations.
· The Legislature should consider modifying laws that require resident school districts to pay special education costs of students who choose to enroll outside the district where they reside.
· MDE should evaluate its monitoring process to identify ways to improve special education teachers’ understanding of compliance requirements.
· MDE should continue efforts to streamline paperwork required in special education and identify effective practices from districts to encourage additional efficiencies.
· MDE should update its special education rules for consistency with Minnesota statutes.
Report Summary
Court rulings have established students’ constitutional right to education regardless of their disabilities. In response, special education provides special instruction and services targeted to the needs of children with qualifying disabilities.
The Minnesota Department of Education (MDE) is responsible for general supervision of special education. Around the state, school districts, charter schools, and numerous cooperative entities—collectively known as local education agencies (LEAs)—provide special education. They have responsibilities for identifying children with disabilities, assessing children’s eligibility for special education, and developing individualized education programs (IEPs) that specify services to meet each student’s needs. Both the state and LEAs have responsibilities for implementing safeguards that protect the rights of children with disabilities and their families.
The number of Minnesota students receiving special education increased 11 percent between the 1999-2000 and 2010-2011 school years, while the number of K-12 public school students decreased 3 percent in that period. The proportion of all public school students in special education rose from 11.9 percent in 1999-2000 to 13.6 percent in 2010-2011.
[Sidebar]
Nearly three-quarters of Minnesota rules pertaining to special education contained provisions that exceeded federal requirements.
[End of Sidebar]
Students must have 1 of 13 disabilities to qualify for special education, and not every student with a disability is eligible. The largest proportion of Minnesota students in special education (27 percent) have “specific learning disabilities” (disorders affecting the use of spoken or written language). The smallest proportion of students, at less than one-tenth of a percent, was in the deaf-blind category.
Students in special education are assigned to an instructional setting, depending on the percentage of the school day they spend outside the general education classroom. Laws require that students are educated with their peers in the least-restrictive appropriate setting. For the 2010-2011 school year, more than 60 percent of Minnesota students in special education were in general education classrooms for most of the day—the least-restrictive setting.
Analysis of a sample of 137 students’ IEPs and progress reports from the 2010-2011 school year showed that students met only 8 percent of their goals but made progress on 88 percent of their remaining goals. About 87 percent of students in special education graduated in 2010, which exceeded the target for statewide special education graduation set by MDE at 85 percent.
Many Minnesota statutes and rules on special education exceed federal requirements, but analyses of their educational and economic impacts are not available.
Of the 45 Minnesota statutes we studied that specifically govern special education, 19 contain at least one provision that exceeds federal requirements. Plus, nearly 75 percent of the 57 Minnesota rules we analyzed contained provisions that exceed federal requirements.
Regulations specific to Minnesota may affect student eligibility, add to responsibilities of school district staff, or increase required documentation. They can increase costs directly, such as when state requirements have a broader definition of eligibility. For instance, state rules define eligibility for the visually-impaired disability category to include a student with a visual impairment that “interferes with acquiring information or interaction with the environment,” whereas federal regulations limit eligibility to those students whose impairment adversely affects “educational performance.” Other rules, such as those adding to workloads that may lead to staff burnout and low teacher retention rates, can affect costs indirectly. However, detailed analyses are not available on costs or benefits of Minnesota-specific regulations and are beyond what could be achieved in this evaluation.
The Legislature should direct MDE to initiate independent analyses of economic and educational impacts of any potential changes to state regulations, such as those that affect district staffing levels. Such analyses are needed to help legislators make informed decisions. Identifying which state requirements to analyze should be the Legislature’s prerogative. MDE could contract with an independent third party to evaluate costs and benefits of any proposed changes, including projected economic impacts, such as students’ ability to eventually obtain employment. Results should be reported to the Legislature for final decisions on changing state law.
School districts have diverted a substantial portion of general education aid and local operating levies to pay for special education.
Revenues for special education come from the state, local school districts, and the federal government. From fiscal year 2000 to 2011, a median 56 percent of revenue was from the state; this included (1) dedicated special education revenues and (2) a portion of general education revenue that follows students in special education. A median 33 percent of revenue was from school districts, representing a combination of general education revenues generated by all students and local revenues from voter-approved levies. A median 11 percent of revenue came from the federal government.
To the extent school districts use a portion of their general education revenues or their referendum levies to pay special education costs, they are said to “cross subsidize” special education. School officials reported that they have had to spend money intended for general education purposes (such as lowering general class sizes) on special education instead. Between fiscal years 2000 and 2011, the school district cross subsidy increased 40 percent in 2011 dollars adjusted for inflation. The largest per-student cross subsidies in 2011 were mostly in school districts in the metropolitan area and regional centers around the state.
The Legislature should consider options to reduce certain school districts’ substantial reliance on general education funding to pay for special education costs. Several alternatives can be used for this, but nearly all involve additional state revenues. At the same time, MDE should identify methods to help control spending and assist districts in adopting appropriate methods that meet student needs and contain costs.
School districts must pay costs of special education for their resident students but have little control over spending when resident students receive services outside the district.
When students in special education enroll in a district other than the district in which they live, the law requires enrolling districts to plan and provide special education services, while resident districts pay for those costs that are not reimbursed by state aid. School officials we interviewed said, as resident districts, they are not sufficiently involved in service decisions for students in special education who enroll elsewhere. They viewed this as a disincentive for enrolling districts to control costs.
The Legislature should consider modifying laws that require school districts to pay special education costs of students who enroll outside their resident districts. The Legislature would have to determine the appropriate proportion of costs to share and ensure that districts do not deny enrollment applications based on the severity of students’ needs.
Confusion has arisen over MDE’s system for monitoring LEA compliance with legal requirements.
MDE has a comprehensive system for assuring LEA compliance with special education regulations, as the federal government requires. Monitoring of special education programs occurs on a five-year cycle and involves districts in a self-review of their own compliance. MDE separately monitors local compliance with fiscal requirements. It offers LEAs training and other tools to assist with monitoring and track corrections of noncompliance.
Numerous staff we interviewed from LEAs voiced concerns about what they viewed as inconsistent or petty compliance decisions. For instance, some said they were told one thing by one monitor but something different by another monitor. Teachers said this interferes with writing compliant documents; plus, correcting noncompliance means holding additional IEP team meetings, requiring parents and others to rearrange their schedules and sometimes travel long distances over seemingly trivial matters. In response, MDE staff said districts identify instances of noncompliance during their self-review that MDE monitors would not. Further, MDE takes steps to achieve consistency among monitors. Yet district dissatisfaction persists.
MDE should evaluate its monitoring process to identify ways to improve special education teachers’ understanding of compliance requirements. It should ensure that teachers have the tools they need to comply with regulations.
Several state rules on special education are inconsistent with Minnesota statutes.
Some administrative rules pertaining to special education are outdated and differ from state statutes. For example, one rule states that if parents refuse consent for an evaluation of their child’s eligibility for special education, the district may continue to pursue an evaluation by using certain procedures. Statutes, though, disallow districts from overriding written refusal of parents to consent to their child’s evaluation.
MDE should update administrative rules on special education for consistency with statutes. MDE does not have general rulemaking authority and may need explicit legislative authorization to proceed.
Introduction
Special education is required by law to be available to students who are eligible due to disabilities that may affect their ability to learn. Special education is an entitlement—meaning everyone who qualifies will receive services.
Legislators raised concerns in 2012 over the rising costs of special education. In late March 2012, the Legislative Audit Commission directed the Office of the Legislative Auditor to evaluate special education in Minnesota. We focused the evaluation on answering these questions:
· What are the characteristics of students receiving special education, and how have they changed over time?
· What are the costs of special education, and what factors drive those costs?
· To what extent do Minnesota’s requirements for special education exceed federal requirements, and what are the practical effects of certain requirements specific to Minnesota?
Minnesota law requires that special education be available to qualifying children from birth through age 21. This evaluation, however, focused on special education in kindergarten through 12th grade. (Twelfth graders include not just students who graduate at age 17 or 18, but those who remain in school up to age 21.) We did not evaluate the early childhood services available for eligible preschoolers, toddlers, and infants, although we report some data related to them.
To answer our research questions, we interviewed many involved and interested people. In the Minnesota Department of Education (MDE), we spoke primarily with staff in three divisions: Special Education, School Finance, and Compliance and Monitoring. We also interviewed representatives of parent and advocacy groups. These included the Arc of Minnesota, the Autism Society of Minnesota, the Governor’s Council on Developmental Disabilities, the Minnesota Disability Law Center, the National Alliance on Mental Illness–Minnesota, and the PACER Center. We interviewed staff from school districts, charter schools, intermediate districts (created to provide cooperative programs, including for special education, to their member school districts), and other cooperative education entities. In addition, we interviewed individuals from the following associations and interest groups: Education Minnesota, Minnesota Administrators for Special Education, North Central Regional Resource Center at the University of Minnesota, Minnesota Association of School Business Officials, and Minnesota Association for Pupil Transportation.
We observed meetings of relevant groups. These included the Special Education Advisory Panel (a panel required in federal law as an advisor to MDE on special education), the public policy committee of the Governor’s Council on Developmental Disabilities, the Autism Spectrum Disorder Task Force, and quarterly forums held by MDE for special education directors from school districts around the state. We also toured multiple school facilities in two intermediate districts and observed classrooms with students in special education.
To understand issues from the view of local education agencies (LEAs), we selected eight case studies for more in-depth analysis. We based our selection on multiple factors, including type of LEA, geographic location, and special education enrollment size, among others. We visited each site and interviewed three sets of staff: special education directors, school business officials, and small groups of teachers. In advance of each visit, we collected background information, such as the numbers of students in special education, the types of special education programs available in the district, and the most recent results from each district’s compliance monitoring conducted by MDE.
From each of our case study LEAs, we collected information on a small sample of students from the 2010-2011 school year. We examined these students’ individualized education programs (IEPs) and progress reports from that year and analyzed students' progress on their goals and short-term objectives. For perspectives from parents, we randomly selected three families from each of our case study LEAs and asked them to answer a small number of questions on their satisfaction with their children’s special education services. Parents from 11 families responded to our questionnaire (42 percent of the 24 families we contacted). Results from our parent questionnaire gave us parental insights on special education services within our case study LEAs and were not intended to be representative of all parents’ views.
We analyzed pertinent laws and rules at the federal and state levels of government. Although several federal laws contain provisions that apply to children with disabilities, we limited our analysis to the Individuals with Disabilities Education Act of 2004 and the federal regulations that apply to that act. We compared that act to various chapters of Minnesota statutes.[1] We also compared federal regulations to Minnesota rules, primarily the rules on children with a disability (Minnesota Rules, chapter 3525). The comparisons allowed us to identify where Minnesota requirements exceeded federal ones. We did not separately compare guidance issued by MDE, such as online “Q & A” (question and answer) documents, against federal guidance because MDE’s written guidance is based on existing rule and law and is not mandatory for school districts.
After identifying state requirements that exceeded federal requirements, we compared our work with other similar efforts completed by legislative task forces in 2008 and 2009 and a 1998 Minnesota Department of Children, Families, and Learning report. We also sought input on our conclusions from the Minnesota School Boards Association and the Minnesota Disability Law Center.
To understand the practical effects of certain requirements specific to Minnesota, we convened five focus groups with participants from different parts of the state. Our intent was to obtain perspectives on requirements that had been identified as potentially costly, time-consuming, or duplicative. Participants in two of the groups were special education directors; one group was of directors from outside the metropolitan area and the other from within the metropolitan area (the latter group also included business officials from metropolitan school districts). Participants in two other groups were parents or advocates who work with parents and their children in special education. One of these two parent and advocate groups had participants from northern Minnesota; the second group’s participants were from the metropolitan area. The fifth group consisted of school business officials from northern Minnesota.
Answering our research questions also required numerous data analyses. We obtained data from MDE on students in special education as well as on funding special education. Student data came primarily from two department databases: the Minnesota Automated Reporting Student System and the Federal Unduplicated Child Count database. Other student-related data came from MDE’s annual performance report, a federally required report on the status of special education. Funding data came from multiple sources within MDE’s Division of School Finance. The chief source of information on expenditures was MDE’s Electronic Data and Reporting System. Multiple other data sets provided information on funding sources and trends.
Another part of our analysis covered MDE’s processes for ensuring school district compliance with federal and state regulations. After interviewing department staff, we examined MDE documents on the compliance process, analyzed data on numbers of citations of noncompliance, and reviewed a sample of school districts’ corrective action plans.
This evaluation report has two appendices. Appendix A provides information on the eight local education agencies we selected as case studies. Appendix B lists the state special education requirements that we identified as exceeding federal requirements. The full report and both appendices are available online at http://www.auditor.leg.state.mn.us/ped/2013/sped.htm.
[1] This included all of Minnesota Statutes 2012, chapter 125A, which covers exclusively special education, as well as relevant portions of chapters 121A, 123A, 123B, 124D, 126C, 127A, and 128B.
Chapter 1 -Background
Special education is intended to provide to children with qualifying disabilities the special instruction and services appropriate to their needs. By Minnesota law, school districts must provide such services to children with disabilities.[1] Federal law and regulations also apply.[2] Minnesota statutes require providing instruction and services from a child’s birth through age 21, but this report focuses primarily on special education in kindergarten through 12th grade.
This chapter provides background information on how special education is defined and the types of disabilities that qualify children for special education. It explains key federal legal requirements for special education. The chapter also describes three groups involved with special education in Minnesota: Minnesota Department of Education (MDE), local education agencies that deliver special education in the state, and special education parent and advocacy groups.
Special Education Defined
Purpose
According to federal regulation, the purpose of special education is to “ensure that all children with disabilities have available to them a free appropriate public education that emphasizes special education and related services designed to meet their unique needs and prepare them for further education, employment, and independent living.”[3] Besides classroom instruction, special education includes physical education and services such as speech-language pathology and audiology services.[4]
[Sidebar]
According to federal law, the purpose of special education is to ensure that all children with disabilities have available to them a free and appropriate public education.
[End of Sidebar]
Disability Categories
To be eligible for special education, a student must meet the eligibility criteria for one of 13 disability categories specified in federal regulation and further defined in Minnesota rules. Simply having a disability does not make a student eligible for special education; for some disability categories, the disability must adversely affect the student’s educational attainment. The disability categories as defined in Minnesota rules are:
· autism spectrum disorders,
· deaf-blind,
· deaf and hard of hearing,
· developmental cognitive disabilities,
· developmental delay,
· emotional or behavioral disorders,
· other health disabilities,
· physically impaired,
· severely multiply impaired,
· specific learning disabilities,
· speech or language impairments,
· traumatic brain injury, and
· visually impaired.
Definitions of each of these categories, along with analysis of the number of students in each disability category are presented in Chapter 2.
[Sidebar]
Students must meet eligibility criteria in one of 13 disability categories to qualify for special education.
[End of Sidebar]
Federal Legal Requirements
Children with disabilities’ rights to a public education are protected under various federal provisions. Federal courts have applied the equal protection clause of the U.S. Constitution’s 14th amendment to establish students’ constitutional right to education regardless of their disabilities. In cases from the early 1970s, courts concluded that schools may not discriminate on the basis of a child’s disability.[5] They required school districts to provide students with disabilities programs that were suited to the students’ own needs. Federal laws, such as the Rehabilitation Act of 1973, reinforced similar principles by prohibiting recipients of federal funding (including school districts) from discriminating against people based on their disabilities.
[Sidebar]
Federal courts have established students’ constitutional right to education regardless of their disabilities.
[End of Sidebar]
The principal federal law ensuring children with disabilities receive a free and appropriate public education is the Individuals with Disabilities Education Act.[6] This act was originally passed as the Education for All Handicapped Children Act of 1975 and was most recently reauthorized in 2004. Under this act, children with disabilities are entitled to special education and related services, such as transportation and occupational therapy.[7] Services must be designed to meet children’s unique needs in the “least restrictive environment,” meaning children with disabilities must be educated to the maximum extent appropriate with children who are not disabled. Separate classes and schools may be used only when education cannot be satisfactorily achieved in general classes with the use of supplementary services.[8]
The Individuals with Disabilities Education Act has separate sections dealing with children in different age groups. Part B of the act pertains to special education and related services for children of 3 to 21 years of age. Part C is concerned with early intervention services to infants and toddlers with disabilities (birth to age two). States may choose to comply with the requirements in the act in order to receive federal funds for special education, and currently all states participate in both parts B and C.
To receive federal funding for special education under this act, states are required to provide assurances that they meet all requirements of the law. Key requirements include the following.
Child find. Local education agencies (LEAs, which include school districts, charter schools, and cooperative entities), must identify, locate, and evaluate all children (including children parentally placed in private schools and homeless children) with disabilities who are in need of special education. The LEA has an obligation to act on its own suspicions that a child may have special education needs by monitoring for sudden changes in grades, behavior, or attendance; major behavioral incidences; and other indicators. LEAs must also respond to parents’ requests for a special education evaluation and screen students for special education needs when they are placed in a care-and-treatment facility. Each LEA must establish procedures and policies for complying with the child find requirement.
[Sidebar]
Students receive special education services based on their needs as specified in an individualized education program (IEP).
[End of Sidebar]
Evaluation. States or local education agencies must conduct initial evaluations to determine whether a child has a disability as defined by federal law and identify the needs of the child before providing special education. Children receiving special education services must be reevaluated for eligibility at least every three years.
Individualized education programs (IEPs). Children with disabilities as defined by the act are provided with special services in accordance with this written plan. Eligible students’ needs are described in their IEPs. The IEP must also state the child’s current level of academic achievement and functional performance, measurable annual goals, how goals will be measured, and a description of special education and program modifications that will be provided to the child, among other things.
Procedural safeguards. States and local education agencies must establish and follow certain guidelines to protect children with disabilities and their parents’ rights regarding a free and appropriate public education. These protections include prior written notice before the LEA proposes or refuses to initiate changes to a student’s program or placement; opportunities for parents to present a due process complaint notice regarding identification, evaluation, or educational placement of a child; and access to mediation and due process hearings to resolve disputes. Mediation allows parties to meet with a qualified, impartial mediator to discuss and attempt to resolve disagreements on any matter in the Individuals with Disabilities Education Act. When agreements are reached through mediation, they are written in a legally binding document. Due process hearings are another form of resolving disputes. They may occur after a formal complaint is filed. LEAs have 30 days to resolve parental complaints; if the complaint has not been resolved, a due process hearing is held and presided over by a hearing officer. Parties to a hearing have the right to be accompanied and advised by attorneys, present evidence, and cross examine witnesses.
[Sidebar]
Federal law requires states to establish and follow guidelines to protect the rights of students receiving special education and their families.
[End of Sidebar]
At the federal level, the secretary of the U.S. Department of Education oversees implementation of the Individuals with Disabilities Education Act, makes grants to states to assist in providing special education services, and offers technical assistance to states. The department is authorized to oversee the act using state performance plans that evaluate a state’s efforts in implementing the law. The state performance plans and the related annual performance reports focus on 20 key indicators—10 results indicators, 9 compliance indicators, and 1 indicator that has both results and compliance components—which are listed in Exhibit 1.1.[9] We do not discuss all of these indicators in this evaluation report. Rather, we touch on specific indicators as they relate to our other evaluation activities. In particular, we discuss some results indicators related to student performance in Chapter 2, and we discuss certain compliance indicators in the context of Minnesota’s oversight of special education in Chapter 4.
Special education must be provided in accordance with applicable federal and state requirements. Some Minnesota statutes and rules reinforce or implement federal requirements while others apply specifically and only to special education within the state. Chapter 5 describes certain requirements specific to Minnesota.
Exhibit 1.1: Federal Performance Indicators, 2012
|
Indicator Reporting Requirement |
Type |
|
|
|
|
|
|
1 |
Percentage of youth with individualized education programs (IEPs) graduating from high school with a regular diploma |
Results |
|
|
|
|
|
2 |
Percentage of youth with IEPs dropping out of high school |
Results |
|
|
|
|
|
3 |
Participation and proficiency rates for children with IEPs on statewide assessments and percentage of school districts that meet the state’s adequate yearly progress targets for disability subgroups |
Results |
|
|
|
|
|
4 |
Percentage of districts that have a significant discrepancy in the rate of suspensions and expulsions of greater than 10 days per school year for children with IEPs, both overall and by race and ethnicity |
Results and Compliance |
|
|
|
|
|
5 |
Percentage of children age 6 to 21 with IEPs who were served: (a) in the general classroom 80 percent or more of the day; (b) in the general classroom less than 40 percent of the day; and (c) in separate schools, residential placements, or homebound/hospital placements |
Results |
|
|
|
|
|
6 |
Percentage of preschool children with IEPs that receive special education in settings with typically developing peers |
Results |
|
|
|
|
|
7 |
Percentage of preschool children with IEPs demonstrating improved positive social-emotional skills, acquisition of knowledge and skills, and use of appropriate behaviors to meet their needs |
Results |
|
|
|
|
|
8 |
Percentage of parents whose students received special education and who reported that schools facilitated parent involvement |
Results |
|
|
|
|
|
9 |
Percentage of districts with disproportionate representation of racial and ethnic groups in special education resulting from inappropriate identification |
Compliance |
|
|
|
|
|
10 |
Percentage of districts with disproportionate representation of racial and ethnic groups in specific disability categories resulting from inappropriate identification |
Compliance |
|
|
|
|
|
11 |
Percentage of children evaluated within 30 school days of parental consent for initial evaluationa |
Compliance |
|
|
|
|
|
12 |
Percentage of children referred by Part C prior to age 3, who are found eligible for Part B, and who have an IEP developed and implemented by their third birthdayb |
Compliance |
|
|
|
|
|
13 |
Percentage of youth age 16 and older with IEPs that include appropriate, measurable postsecondary goals |
Compliance |
|
|
|
|
|
14 |
Percentage of youth who had IEPs in effect at the time they left high school and were either employed, enrolled in higher education, or enrolled in postsecondary education or a training program within one year of leaving school |
Results |
|
|
|
|
|
15 |
Percentage of school district noncompliance with legal standards corrected within one year |
Compliance |
|
|
|
|
|
16 |
Percentage of signed written complaints with reports issued that were resolved within a 60-day timeline or a timeline extended due to exceptional circumstances or an agreement between parties |
Compliance |
|
|
|
|
|
17 |
Percentage of adjudicated due process
hearing requests that were fully adjudicated within the |
Compliance |
|
|
|
|
|
18 |
Percentage of hearing requests that went to resolution sessions and were resolved through resolution session settlement agreements |
Results |
|
|
|
|
|
19 |
Percentage of mediations held that resulted in mediation agreements |
Results |
|
|
|
|
|
20 |
Percentage of state-reported data that were timely and accurate |
Compliance |
NOTES: The U.S. Department of Education uses these indicators to determine whether states are satisfactorily implementing the Individuals with Disabilities Education Act. States set targets and data collection methods for each indicator in state performance plans and document progress with respect to each indicator in annual performance reports. Indicators marked “compliance” are those that the federal government uses to determine whether a state is meeting the act’s requirements. “Results” indicators relate largely to student performance, and must be reported to the U.S. Department of Education, but are not factored into compliance determinations.
a The federal requirement is actually 60 days, unless the state has established a different timeline, in which case the state must report its results relative to that timeline. Minnesota requires that evaluations be conducted within 30 school days of receiving parental consent.
b Part C of the Individuals with Disabilities Education Act covers students from birth to age two, while Part B covers children age 3 to 21.
SOURCE: Minnesota Department of Education, Minnesota Part B Annual Performance Report (APR) Federal Fiscal Year 2010 (2010-2011) (Roseville, 2012).
Special Education in Minnesota
Minnesota Department of Education
The Minnesota Department of Education (MDE) is responsible for general supervision of special education. This includes ensuring that LEAs comply with legal requirements and meet education standards, maintaining procedures for resolving complaints, and establishing goals for performance of children with disabilities.
Department Resources for Special Education
MDE’s Division of Special Education is the principal division involved with special education policy. Its stated focus is ensuring that all children receiving special education get the necessary support for their “healthy development and lifelong learning.”[10] Duties of this division include planning and setting overall direction for special education, providing technical assistance to LEAs, maintaining expertise in the different disability categories, collecting and analyzing performance data, facilitating services for low-incidence disabilities, and fostering interagency partnerships.
The department’s Division of Compliance and Monitoring helps fulfill federal requirements for state monitoring and enforcement of regulations pertaining to the Individuals with Disabilities Education Act. It monitors LEAs’ programs for compliance with the act’s regulations. Further, the division administers the federally required system for handling complaints about special education; this includes arrangements, such as mediation and formal hearings, to resolve complaints. Among its other duties, the division maintains expertise on federal laws related to special education and investigates reports of maltreatment of minors in school districts.
[Sidebar]
The Minnesota Department of Education is responsible for ensuring that local education agencies comply with legal requirements pertaining to special education.
[End of Sidebar]
MDE also has a Division of School Finance. Among its staff, the division has a team working exclusively on special education funding. The division maintains multiple data systems for budgeting, calculating, and tracking federal and state funding for special education as well as for collecting and reporting student data.
To conduct its work:
· In fiscal year 2011, the Minnesota Department of Education spent $234 million on department duties related to special education, exclusive of revenues distributed to local education agencies.
Department expenditures (adjusted for inflation) on special education generally increased each year from fiscal year 2000 to 2011, with the exceptions of fiscal years 2006, 2008, and 2010, as Exhibit 1.2 shows. Expenditures include all MDE activities related to special education, including those for students in K-12 grades as well as infants, toddlers, and other children of preschool age.[11]
Exhibit 1.2: Minnesota Department of Education Resources Related to Special Education, Fiscal Years 2000-2011
|
Fiscal Year |
Expenditures (in millions)a |
Percentage Annual Change in Expenditures |
Percentage of Total MDE Spendingb |
Full-Time-Equivalent (FTE) Staffc |
Percentage Change in Annual FTEs |
Percentage of Total MDE FTEsb |
|
|
|
|
|
|
|
|
|
2000 |
$102.5 |
— |
9.8% |
59.2 |
— |
11.1% |
|
2001 |
114.1 |
11.3% |
11.7 |
66.7 |
12.8% |
12.3 |
|
2002 |
136.8 |
19.9 |
13.7 |
67.5 |
1.2 |
13.0 |
|
2003 |
155.2 |
13.4 |
14.4 |
76.7 |
13.6 |
15.7 |
|
2004 |
179.4 |
15.6 |
23.5 |
71.0 |
-7.4 |
17.6 |
|
2005 |
211.7 |
18.0 |
24.7 |
67.5 |
-5.0 |
16.3 |
|
2006 |
204.2 |
-3.5 |
26.2 |
69.1 |
2.3 |
16.4 |
|
2007 |
220.1 |
7.8 |
27.4 |
79.8 |
15.5 |
18.4 |
|
2008 |
203.1 |
-7.7 |
27.1 |
81.1 |
1.7 |
19.1 |
|
2009 |
208.1 |
2.5 |
26.9 |
79.5 |
-1.9 |
19.6 |
|
2010d |
176.2 |
-15.4 |
13.5 |
81.3 |
2.2 |
20.2 |
|
2011 |
234.0 |
32.8 |
20.0 |
84.3 |
3.7 |
21.1 |
NOTE: Resources include those for all Minnesota Department of Education (MDE) activities related to special education, including for students in grades K-12 as well as children of preschool age. Data could not be fully disaggregated between activities related exclusively to students and those to infants, toddlers, and other preschoolers.
a Department expenditures only; excludes state education aid provided to local education agencies. Expenditures are adjusted for inflation and expressed in 2011 dollars.
b Represents MDE’s special education resources as a percentage of total department resources. Expenditures are adjusted for inflation.
c Full-time equivalent (FTE) is a unit of measuring workload for consistency across full-time and part-time positions; an FTE of 1 equals one full-time staff person.
d Department personnel attribute the significant drop in expenditures for fiscal year 2010 in large part to payment delays caused by implementation of a new database and software.
SOURCE: Office of the Legislative Auditor, analysis of Minnesota Department of Education data on department expenditures and full-time-equivalent staff, fiscal years 2000-2011.
Department spending on special education represented 20 percent of all department expenditures in fiscal year 2011, about 10 percentage points higher than fiscal year 2000. The share of department spending going to special education increased fairly steadily up through 2007 and 2008, when it accounted for more than a quarter (27 percent) of all department expenditures. Although the share dropped slightly in 2009 and more significantly in 2010, it rose again in fiscal year 2011 by 6 percentage points (up to 20 percent of all department spending).[12]
Like expenditures, department staffing for special education has increased over time. MDE data show:
· The department employed 84.3 full-time-equivalent staff in fiscal year 2011 for its special education duties.
Staffing throughout the department for special education duties increased by about 25 full-time-equivalent (FTE) staff since fiscal year 2000. However, the year-to-year change in such staffing levels was mixed since 2000, as Exhibit 1.2 showed. Counts include all MDE staff for activities related to special education, including those for students in K-12 grades as well as younger children.
MDE staff working on special education represented about 21 percent of all department staff in fiscal year 2011. This represents a fairly steady increase since fiscal year 2000, when 11 percent of MDE’s FTE staff worked on special education.
Local Education Agencies
Minnesota public and nonpublic students with disabilities may receive special education from one or more of the LEAs providing public education in the state.[13] Eight of these LEAs are described below.
[Sidebar]
School districts, charter schools, and a variety of cooperative education entities offer special education to qualifying students attending public and private schools.
[End of Sidebar]
Independent School Districts
The Minnesota Constitution requires the Legislature to create a uniform system of public schools throughout Minnesota. As of the 2010-2011 school year, the system included 335 independent school districts that cover the entire state and provided special education to 103,712 students.[14] Independent districts are directed by a board of six or seven publically elected officials, which may levy local taxes to provide public education. Throughout this report we will refer to independent school districts simply as “school districts” or “districts.”
Charter Schools
Charter schools are public schools formed by parents, teachers, or community members outside the independent school district structure. During the 2010-2011 school year, 149 charter schools provided special education to 4,823 students. Charter schools are required to meet statewide accountability requirements and follow other specified regulations but are not subject to all statutes pertaining to school districts. Applications to form charter schools must be approved by an authorizer that monitors and evaluates fiscal, operational, and student performance, as well as by MDE. Charter schools are governed by a board of directors made up of at least five members elected by school staff and students’ parents. Charter schools must comply with Minnesota special education requirements, and some schools have created specialized programs for students with specific disabilities, including deafness or autism spectrum disorders.
Cooperative Entities
Minnesota statutes authorize various types of structures for school districts and charter schools to cooperatively provide special education and other services. The four we focused on are: intermediate school districts, special education cooperatives, education districts, and service cooperatives. These cooperative entities must allocate their approved special education expenditures among member districts, and special education aid for services provided by cooperative entities must be paid to member districts. Local education agency staff told us cooperative entities assist schools to provide a full range of special education and related services when it would be difficult or costly for a single school district to provide those services on its own. Some cooperative entities provide direct special education services to students, while others provide more indirect services, such as consultation. Enrollment figures presented in this section are only for students served in programs run by the cooperatives.
[Sidebar]
Cooperative education entities offer special education services that would be too costly for a single district to provide alone.
[End of Sidebar]
Intermediate School Districts
Intermediate districts offer cooperative programs for students in vocational education, special education, and other authorized services. State law authorizes three intermediate districts in the metropolitan area that provided special education to 1,449 students in the 2010-2011 school year. Each intermediate district is composed of several independent member districts. Intermediate districts are run by a joint school board, the duties of which are specified in an agreement among member districts. The joint board may receive and disburse federal and state funds. The three districts are: District 287, which primarily serves Hennepin and Wright counties; District 916, which primarily serves Anoka, Ramsey, and Washington counties; and District 917, which primarily serves Dakota and Goodhue counties. Intermediate district staff told us school districts are able to appropriately serve most students within their home districts but rely on the intermediate districts to provide services to students with the most challenging needs.
Special Education Cooperatives
School districts may enter into a joint-powers agreement to create a special education cooperative that allows them to cooperatively exercise the powers of a school district. The agreement may allow one or more of the member districts to exercise powers on behalf of the other member districts. School districts must enter into a formal agreement and may choose to form a joint governing board. They may also choose for public funds to be paid to, and disbursed by, the cooperative. During the 2010-2011 school year, 11 special education cooperatives provided special education to 558 students.[15]
Education Districts
Education districts are established to “increase educational opportunities for learners by increasing cooperation and coordination among school districts….”[16] These districts are authorized to provide a variety of services including curriculum development, administrative services, and special education. Education districts may be formed by five or more contiguous districts or, alternately, four districts with a total of at least 5,000 students or 2,000 square miles. Their boards must include at least one representative appointed by each member district, and the boards are responsible for coordinating programs and services according to a written agreement. Eleven education districts provided special education to 437 students in the 2010-2011 school year.[17]
[Sidebar]
State law has established ten service cooperatives that provide various educational services including services for students receiving special education.
[End of Sidebar]
Service Cooperatives
Minnesota law establishes ten service cooperatives along geographic boundaries to meet regional needs as specified by each cooperative’s members. The service cooperatives may provide various educational programs and services including media and technology centers, staff development, and services for students with special talents and needs. Full cooperative membership is limited to public school districts, cities, counties, and other governmental units. Service cooperatives are managed by a board of directors composed of 6 to 15 members, the majority of whom sit on member school boards. Few service cooperatives provide direct special education services; service cooperatives provided special education to only 85 students in the 2010-2011 school year.
Minnesota State Academies
Minnesota operates a State Academy for the Blind and a State Academy for the Deaf, where a combined 184 students received special education in the 2010-2011 school year. The academies are primarily residential schools governed by a single nine-person board appointed by the Governor and approved by the Senate. The board is responsible for promoting high academic standards and an assessment system that measures student performance. Students remain residents of the district in which their parents reside, and their resident districts are responsible for paying for special education services that are not reimbursed by the state.
Department of Corrections
School districts in which residential corrections facilities are located are responsible for providing education, including special education, to eligible students. The Department of Corrections may also choose to license and operate education programs on-site, such as the Minnesota Correctional Facility–Red Wing, in which case the Commissioner of Education must approve those programs. Education programs operated by the Department of Corrections must conform to state and federal education laws. The Department of Corrections provided special education to 100 students on-site in the 2010-2011 school year.
Parents and Advocacy Groups
Minnesota has an active community of organizations that work with students with disabilities and represent parents of children receiving special education. Some organizations have been established in law, while others are member-based, nonprofit organizations.
[Sidebar]
Minnesota has an active community of governmental and nonprofit agencies that work on behalf of students with disabilities and their families.
[End of Sidebar]
Federal regulations require states to establish and maintain an advisory panel with members involved with special education, including parents, teachers, and individuals with disabilities, among others.[18] In Minnesota, this is the Special Education Advisory Panel. The panel’s function is to advise MDE in several areas, such as on unmet needs in the education of children with disabilities and the development of policies on coordinating services for these children. Among its duties, the panel participates in setting targets for the performance indicators measured as part of the federally required annual performance report mentioned earlier in this chapter.
Minnesota also established the Governor’s Council on Developmental Disabilities as required by federal law.[19] The Council is funded through the federal Developmental Disabilities Assistance and Bill of Rights Act, first passed in 1963; the Governor is required to appoint council members. Its stated purpose is to provide information and training that leads to “increased independence, productivity, self determination, integration and inclusion for people with developmental disabilities.” The council has been involved with special education over the years and played a role when Minnesota passed legislation to provide special education to children under the age of five.
Minnesota’s Disability Law Center is a statewide project of the private, nonprofit Mid-Minnesota Legal Aid. The center serves as the state’s designated “protection and advocacy” program for Minnesotans with disabilities, which is required by federal law and has the stated purpose of protecting the legal and human rights of people with developmental disabilities.[20] Like the Governor’s Council on Developmental Disabilities, the center receives part of its funding though the federal Developmental Disabilities Assistance and Bill of Rights Act. Among the center’s work is to advocate on behalf of people with disabilities, offer legal representation to them, and work to ensure consistency around the state in the services available to those with disabilities. Members of the center’s staff have participated in policy-making task forces and rule-making advisory committees related to special education. For instance, the law center participated in legislatively mandated task forces in 2007 and 2008 that compared federal and state regulations on special education.
[Sidebar]
PACER Center is a private, nonprofit parent center that provides information and training to parents of children with disabilities.
[End of Sidebar]
A number of nonprofit organizations and coalitions work on behalf of people with disabilities, including students receiving special education and their families. One is PACER Center, which is a private, nonprofit parent center that provides information, training, and support to parents of children with disabilities. PACER Center receives federal funding to serve as the state’s parent training and information center. It provides workshops for parents on their rights and responsibilities within special education law. The center also trains parents on how to communicate effectively with education professionals and navigate the processes in place to resolve complaints that arise over special education matters. PACER Center is also the National Parent Technical Assistance Center for parent training organizations around the country, for which it receives federal grant money.
Other member-based, private, nonprofit organizations also work on special education matters. The Autism Society of Minnesota was established in 1971 and provides support and advocacy for individuals with autism spectrum disorders. It has advocated on behalf of students receiving special education. The National Alliance on Mental Illness–Minnesota is a nonprofit organization that works to improve the lives of people with mental illness and their families. Although the alliance’s mission encompasses more than special education, it worked with others on Minnesota legislation pertaining to the seclusion and restraint of students. The Arc of Minnesota is a nonprofit volunteer organization whose stated mission is to protect the human rights of people with intellectual and developmental disabilities and support their full participation in the community. All three of these organizations participate in the Consortium for Citizens with Disabilities, which is a coalition of about 100 organizations working to help people with disabilities. It has been active in special education issues, such as working to shift the focus from ensuring compliance with regulations to improving outcomes for students receiving special education.
[1] Minnesota Statutes 2012, 125.03 (a).
[2] Individuals with Disabilities Education Act, 20 US Code, ch. 33 (2004); and 34 CFR parts 300 and 301, (2006).
[3] 34 CFR sec. 300.1(a) (2006).
[4] Throughout the rest of this report, the term “special education” is used to convey both special instruction and related services.
[5] See as examples: Pennsylvania Association for Retarded Children (PARC) v. Commonwealth of Pennsylvania, 334 F. Supp. 1257 (E.D. PA 1971); and Mills v. Board of Education, 348 F. Supp. 866 (1972).
[6] The act was renamed the Individuals with Disabilities Education Improvement Act when it was reauthorized in Public Law 108-466 (2004). It is codified in 20 U.S. Code, chapter 33, where it states the chapter may be identified as the “Individuals with Disabilities Education Act;” therefore, we will refer to the act as “the Individuals with Disabilities Education Act” throughout the report.
[7] Children enrolled in private schools are also eligible to receive some special education and related services as delineated in a service plan developed by the public school district in which the private school is located. 34 CFR sec. 300.132 (a)-(b); 300.137 (c)(1); and 300.138 (b) (2006).
[8] 20 U.S. Code, sec. 1412(a)(5)(A), (2004).
[9] While several indicators have multiple outcomes to measure, Indicator 4 is the only one that has both results and compliance components. Indicator 4A is the results component, which requires reporting the percentage of districts that have significant discrepancies in the suspension/expulsion rates for students receiving special education. Indicator 4B is a compliance indicator with a similar focus, but specific to race and ethnicity and whether districts have policies, procedures, and practices that contribute to significant discrepancies in suspension/expulsion rates by race and ethnicity.
[10] Minnesota Department of Education, Special Education Policy Division, Foundation Statements (March 26, 2010), 1.
[11] While the focus of this evaluation is primarily on special education for students in K-12 grades, MDE expenditure data include resources for activities related to younger children receiving special education services because the data could not be fully disaggregated between children of preschool age and those older.
[12] Department officials attribute the significant drop in expenditures for fiscal year 2010 in large part to payment delays caused by implementation of a new database and software.
[13] Special education may be provided to students attending nonpublic schools as well as public ones. Under Minnesota Statutes 2012, 125A.18, students eligible for special education cannot be denied special education services on a shared-time basis by their resident public school districts because the students attend a nonpublic school.
[14] Enrollment reported in this chapter is from data that MDE collects for the purpose of reporting special education enrollment numbers to the federal government and reflects students who received special education as of December 1, 2010.
[15] An additional 20 special education cooperatives were listed in MDE data, but those cooperatives did not enroll students in the 2010-2011 school year.
[16] Minnesota Statutes 2012, 123A.15, subd. 1.
[17] MDE data list two additional education districts that did not enroll students in the 2010-2011 school year.
[18] 34 CFR sec. 300.167 and 300.168 (a)(1)-(11) (2006).
[19] Developmental Disabilities Assistance and Bill of Rights Act, Public Law no. 106-402 (2000).
[20] 42 US Code, sec. 15043 (a)(1) (2000).
Chapter 2 - Students Receiving Special Education
Almost 112,000 Minnesota students, with various disabilities, receive special education. To facilitate decisions about special education policy, it is useful for policymakers to be aware of the types of students receiving special education instruction and related services in Minnesota and the environments in which they are being served.
In this chapter, we describe who receives special education. We begin with general information on the number of students receiving special education instruction and related services.[1] We describe the different disabilities affecting students receiving special education in Minnesota, the demographic characteristics of those students, and the instructional settings in which they are served. We then provide information on several measures of success attained by students receiving special education. We conclude with a brief discussion of the cost implications associated with Minnesota’s changing special education population.
Students Receving Special Education
In the 2010-2011 school year, almost 112,000 of Minnesota’s nearly 824,000 K‑12 public school students received special education.[2] We analyzed numbers of students receiving special education over time and found:
· The number of students receiving special education has increased steadily since the 1999-2000 school year, while the number of K-12 public school students statewide has decreased.
The proportion of Minnesota students receiving special education increased slowly, but steadily, in the 12 years we analyzed, from 11.9 percent (about 100,000 students) in 1999-2000 to 13.6 percent (about 112,000 students) in 2010-2011. Exhibit 2.1 shows the trends in special education and overall K-12 student enrollment between 1999-2000 and 2010-2011.
[Sidebar]
The proportion of all K-12 students receiving special education increased from 11.9 percent in the 1999-2000 school year to 13.6 percent in 2010-2011.
[End of Sidebar]
Exhibit 2.1: Student Enrollment Numbers, 1999-2000 through 2010-2011
[NUMERIC REPRESENTATION OF GRAPHIC]
|
School Year |
|
K-12 |
|
Total K-12 Count |
|
1999-2000 |
|
100,300 |
|
845,839 |
|
2000-2001 |
|
102,269 |
|
844,926 |
|
2001-2002 |
|
102,964 |
|
841,697 |
|
2002-2003 |
|
104,286 |
|
836,826 |
|
2003-2004 |
|
105,328 |
|
832,039 |
|
2004-2005 |
|
105,774 |
|
827,331 |
|
2005-2006 |
|
106,510 |
|
827,259 |
|
2006-2007 |
|
107,528 |
|
828,246 |
|
2007-2008 |
|
108,810 |
|
824,783 |
|
2008-2009 |
|
109,419 |
|
822,412 |
|
2009-2010 |
|
110,560 |
|
823,003 |
|
2010-2011 |
|
111,794 |
|
823,525 |
NOTES: This exhibit includes public school students in kindergarten through grade 12, as well as nonpublic students in those grades who attended a public school part time. The group “students in special education” includes students receiving special education services as of December 1 of the applicable school year. It does not include students who exited special education prior to December 1, or those who began receiving special education service later in the school year. “All K-12 students” represents the October 1 count of all K-12 students, including those who received special education.
SOURCE: Office of the Legislative Auditor, analysis of Minnesota Department of Education’s Unduplicated Child Count data, 1999-2000 through 2010-2011.
In contrast, the percentage of students receiving special education nationwide has been gradually declining. The federal government collects special education enrollment data from each state and calculates percentages based on the states’ total school-age population.[3] In the 2005-2006 school year, students receiving special education made up 9.2 percent of the eligible population nationwide; by the 2010-2011 school year, the national average had fallen to 8.5 percent. In contrast, students receiving special education made up 9.1 percent of Minnesota’s eligible school-age population in 2005-2006 and 9.4 percent in 2010-2011.[4]
[Sidebar]
In contrast with Minnesota, the percentage of students receiving special education nationwide has been gradually declining.
[End of Sidebar]
In addition to the students in kindergarten through 12th grade who participate in special education, students can be identified for and start receiving special education services before they enroll in school. Minnesota law requires the provision of early intervention services (as needed) from birth. Over the 12-year period we examined, the number of infants, toddlers, and preschool students receiving special education services increased steadily, from about 10,500 children in the 1999-2000 school year to just over 16,000 in the 2010-2011 school year. Our report and the bulk of our analysis, however, focus on special education for K-12 students. Unless otherwise noted, the analysis in this chapter pertains to the K-12 student population, and excludes infants, toddlers, and preschoolers receiving special education.
[Sidebar]
Not all students with disabilities qualify for special education.
[End of Sidebar]
Primary Disability CATEGORIES
As we discussed briefly in Chapter 1, students must have one of 13 disabilities to receive special education. State rule establishes eligibility criteria, and for some disability categories, the student’s educational attainment must be impacted, meaning that not every student with a disability is eligible for special education. Some students, for example, have physical or mental impairments that necessitate certain accommodations in the classroom, but do not rise to the level of requiring special education. Exhibit 2.2 describes the 13 disability categories, as defined in Minnesota rules. Some students receiving special education have more than one disability; for reporting purposes, every student is assigned a “primary” disability, reflecting the disability “which most impacts the child’s functional or academic skills and abilities.”[5] Since the data we analyzed do not include an indication of students’ secondary disabilities, our analyses are based on students’ primary disabilities only. Therefore, the data we report underestimate the prevalence of certain disabilities.
[Sidebar]
The disability category with the largest number of students in 2010-2011 is called “specific learning disabilities,” with 30,542 students; 27 percent of all students receiving special education were in this category.
[End of Sidebar]
During the time period we analyzed, the largest number of students was classified as having specific learning disabilities, although the proportion of such students decreased over time. Exhibit 2.3 shows how the number and distribution of students in the different disability categories changed between the 1999-2000 and 2010-2011 school years. As of 2010-2011, large numbers of students were also classified with speech or language impairments, other health disabilities, emotional or behavioral disorders, and autism spectrum disorders. Disability categories with the largest proportions of students are known as high-incidence disabilities. As the exhibit shows, other disabilities are less prevalent. The lowest-incidence disability categories are deaf-blind, traumatic brain injury, and visually impaired. These categories combined account for less than 1 percent of all of Minnesota’s students receiving special education.
Exhibit 2.2: Minnesota Special Education Disability Categories, 2012
|
Disability |
Description |
|
|
|
|
Autism spectrum disorders
|
A range of pervasive developmental disorders, with onset in childhood, that adversely affect a student’s functioning and result in the need for special education. Autism spectrum disorders may include autistic disorder, childhood autism, atypical autism, pervasive developmental disorder not otherwise specified, Asperger's disorder, or other related pervasive developmental disorders. |
|
|
|
|
Deaf-blind |
A medically verified visual loss coupled with medically verified hearing loss that, together, interfere with acquiring information or interaction with the environment. To be eligible for special education under this category, a student must simultaneously meet the criteria for classification as both visually impaired and deaf and hard of hearing. |
|
|
|
|
Deaf and hard of hearing
|
A diminished sensitivity to sound, or hearing loss, that is expressed in terms of standard audiological measures. The hearing loss has the potential to affect educational, communicative, or social functioning, which may result in the need for special education. |
|
|
|
|
Developmental cognitive disabilities |
A condition resulting in significantly below average intellectual functioning and concurrent deficits in adaptive behavior that adversely affects educational performance and requires special education. For state reporting purposes, students with developmental cognitive disabilities are classified as either mild-moderate or severe-profound. |
|
|
|
|
Developmental delay
|
A condition in which a child up to age 7 has a diagnosed physical or mental condition or disorder that has a high probability of resulting in delayed achievement of developmental milestones. Alternately, the child may have a delay in each of two or more of the areas of cognitive development; physical development, including vision and hearing; communication development; social or emotional development; and adaptive development. |
|
|
|
|
Emotional or behavioral disorders
|
An established pattern of one or more of the following emotional or behavioral responses: withdrawal or anxiety, depression, or problems with mood or feelings of self-worth; disordered thought processes with unusual behavior patterns and atypical communication styles; or aggression, hyperactivity, or impulsivity. The established pattern of emotional or behavioral responses must adversely affect educational or developmental performance. |
|
|
|
|
Other health disabilities
|
Having limited strength, endurance, vitality, or alertness, including a heightened or diminished alertness to environmental stimuli, adversely affecting a student’s educational performance. Symptoms may result from a broad range of medically diagnosed chronic or acute health conditions. Examples of other health disabilities include attention deficit hyperactivity disorder, cardiovascular conditions, and immune deficiency disorders, among other things. |
|
|
|
|
Physically impaired
|
A medically diagnosed chronic, physical impairment, either congenital or acquired, that may adversely affect physical or academic functioning and result in the need for special education. |
|
|
|
|
Severely multiply impaired |
Severe learning and developmental problems resulting from the presence of two or more disability conditions. |
|
|
|
|
Specific learning disabilities
|
A disorder in one or more of the basic psychological processes involved in understanding or using language, spoken or written, that may manifest itself in the imperfect ability to listen, think, speak, read, write, spell, or do mathematical calculations, including conditions such as perceptual disabilities, brain injury, minimal brain dysfunction, dyslexia, and developmental aphasia. |
|
|
|
|
Speech or language impairments |
A fluency, articulation, language, or voice disorder that interferes with the student’s ability to communicate. |
|
|
|
|
Traumatic brain injury |
An acquired injury to the brain caused by an external physical force, resulting in total or partial functional disability or psychosocial impairment, or both, that may adversely affect a student's educational performance and may result in the need for special education. |
|
|
|
|
Visually impaired |
A medically verified visual impairment accompanied by limitations in sight that interfere with acquiring information or interaction with the environment to the extent that special education may be needed. |
SOURCE: Minnesota Rules 2007, chapter 3525.
Exhibit 2.3: Students Receiving Special Education by Primary Disability Category, 1999-2000 and 2010-2011
|
1999-2000 |
2010-2011 |
Percentage Change over 12 Years |
|||
|
|
N |
% |
N |
% |
|
|
|
|
|
|
|
|
|
Specific learning disabilities |
39,314 |
39.1% |
30,542 |
27.3% |
-22% |
|
Speech or language impairment |
17,721 |
17.6 |
17,660 |
15.8 |
0 |
|
Other health disabilities |
6,870 |
6.8 |
16,037 |
14.3 |
133 |
|
Emotional or behavioral disorders |
17,792 |
17.7 |
15,659 |
14.0 |
-12 |
|
Autism spectrum disorders |
2,064 |
2.1 |
13,523 |
12.1 |
555 |
|
Developmental cognitive disabilities |
10,090 |
10.0 |
8,523 |
7.6 |
-16 |
|
Developmental delay |
2,240 |
2.2 |
4,192 |
3.7 |
87 |
|
Deaf and hard of hearing |
1,899 |
1.9 |
2,100 |
1.9 |
11 |
|
Physically impaired |
1,546 |
1.5 |
1,571 |
1.4 |
2 |
|
Severely multiply impaired |
164a |
0.2 |
1,170 |
1.0 |
613 |
|
Traumatic brain injury |
328 |
0.3 |
409 |
0.4 |
25 |
|
Visually impaired |
389 |
0.4 |
346 |
0.3 |
-11 |
|
Deaf-blind |
47 |
< 0.1 |
62 |
< 0.1 |
32 |
|
Total |
100,464 |
100.0% |
111,794 |
100.0% |
11% |
NOTES: This exhibit includes public school students in kindergarten through grade 12, as well as nonpublic students in those grades who attended a public school part time. Data reflect students receiving special education services as of December 1 of the school year in question. They do not include students who exited special education prior to December 1, or those who began receiving special education later in the school year. The percentages in the exhibit reflect the percentages of students receiving special education rather than percentages of all students. For students eligible to receive services in more than one disability area, the data report the “primary disability” that most impacts the student’s functional or academic skills and abilities. Since secondary disabilities are not recorded, the counts above cannot be said to fully reflect the total number of students who have a given disability. Percent columns may not sum to 100 due to rounding.
a The category of severely multiply impaired was not used in years 1999-2000 and 2000-2001. The starting count of 164 presented in this table represents the first available data from year 2001-2002.
SOURCE: Office of the Legislative Auditor, analysis of Minnesota Department of Education’s Unduplicated Child Count data, 1999-2000, 2001-2002, and 2010-2011.
We examined the changes in numbers of students in each of these categories over time and found:
· Autism spectrum disorders was the disability category that experienced the largest numerical growth between the 1999-2000 and 2010-2011 school years.
[Sidebar]
The combined categories of deaf-blind, traumatic brain injury, and visually impaired accounted for less than 1 percent of all students receiving special education in 2010-2011.
[End of Sidebar]
The increase in the number of students with autism spectrum disorders far surpassed the increases in any other disability category. In the 1999-2000 school year, just over 2,000 students’ primary disability was an autism spectrum disorder; since then, the number of students in the category has grown more than 500 percent.[6] Experts are unsure to what extent this growth reflects (1) an actual increase in the number of autistic students, (2) improved identification of students with autism, or (3) other factors. Over the last decade the tools used to diagnose autism spectrum disorders have improved and awareness of the autism spectrum has increased among the medical community and the general public. It is possible that certain students who would have once been classified as having a different disability may today be placed on the autism spectrum. This would be consistent with the observed increase in the number of students with autism spectrum disorders and simultaneous decrease in the number of students with specific learning disabilities and emotional or behavioral disorders.
Characteristics of sTudents Receving Special Education
General Demographic Information
In an effort to describe students receiving special education, we analyzed student enrollment data from the 1999-2000 to 2010-2011 school years. We compared students receiving special education to students who did not receive special education with respect to a number of demographic characteristics, looking for differences between the two groups and changes over time. We recognize that students who receive special education are first general education students and generate general education revenues. But for simplicity in these comparisons, we refer to students who did not receive special education as “general education students.” We found:
· Compared to the general student population, students receiving special education were more likely to be male and from low-income families. They were less likely, however, to have limited English proficiency.
Overall, nearly 70 percent of students receiving special education were male, compared with just under half the general education students. During the 12-year period we examined, there was little change in either the special education or general education populations with respect to gender. The results of our analysis of gender, as well as those of income level, English proficiency, and location of student residence, are shown in Exhibit 2.4.
We also compared students receiving special and general education with respect to a poverty indicator. In the analysis of student enrollment data, a student’s eligibility for free or reduced-price lunch is used as a poverty indicator; students eligible for meal assistance come from lower-income families than those who are not eligible. From the 1999-2000 to 2010-2011 school years, students receiving special education had consistently higher levels of eligibility for free or reduced-price lunch, usually by at least 15-percentage points. The rates of low-income students increased over time for both the special and general education populations.
We also examined the entire population of students eligible for free or reduced-price lunch to determine what proportion received special education. During each of the 12 years analyzed, at least 20 percent of the students who were eligible for free or reduced-price lunch also received special education. Among students who were not eligible for free or reduced-price lunch, however, only 11 percent received special education during each of the years analyzed.
Exhibit 2.4: Student Demographic Characteristics, 1999-2000 and 2010-2011
|
1999-2000 |
2010-2011 |
||||
|
|
N |
% |
N |
% |
|
|
Male |
|
|
|
|
|
|
Special education |
78,351 |
68.2% |
85,238 |
67.9% |
|
|
General education |
377,302 |
49.0 |
353,848 |
48.5 |
|
|
|
|
|
|
|
|
|
Eligible for free or reduced-price luncha |
|
|
|
|
|
|
Special education |
43,615 |
38.0% |
65,333 |
52.1% |
|
|
General education |
177,969 |
23.1 |
252,099 |
34.6 |
|
|
|
|
|
|
|
|
|
Limited English proficiency |
|
|
|
|
|
|
Special education |
3,501 |
3.0% |
8,782 |
7.0% |
|
|
General education |
42,523 |
5.5 |
60,323 |
8.3 |
|
|
|
|
||||
|
Residents of Twin Cities metropolitan areab |
|
|
|
||
|
Special education |
58,135 |
50.6% |
65,807 |
52.4% |
|
|
General education |
403,822 |
52.4 |
397,056 |
54.4 |
|
NOTES: This exhibit includes public school students in kindergarten through grade 12, as well as nonpublic students in those grades who attended a public school part time. “Special education” refers to students who received special education instruction or related services at any point during the school year in question. “General education” refers to the remaining students who did not participate in special education during that year.
a In the analysis of student enrollment data, a student’s eligibility for free or reduced-price lunch is used as a poverty indicator; students eligible for meal assistance come from lower-income families than those who are not eligible.
b These figures reflect the percentage of students who resided in the seven-county metropolitan area during the school year in question. The seven-county metropolitan area consists of Anoka, Carver, Dakota, Hennepin, Ramsey, Scott, and Washington counties. Students do not necessarily attend school in the same county in which they are residents.
SOURCE: Office of the Legislative Auditor, analysis of Minnesota Department of Education’s Minnesota Automated Reporting Student System data, 1999-2000 and 2010-2011.
[Sidebar]
Among students eligible for free or reduced-price lunch from 1999-2010, at least 20 percent each year also received special education; among those
not eligible, 11 percent received special education.
[End of Sidebar]
Students with limited English proficiency are those who (1) learned a language other than English as their first language or for whom English is not the primary language spoken at home and (2) lack the necessary English skills to participate fully in classes taught in English. As Exhibit 2.4 shows, we found that students receiving special education had slightly lower rates of limited English proficiency than students in general education. As with low-income students, the incidence of students with limited English proficiency increased among both students receiving special education and general education over the time period we examined.
Geographic location is an area in which we did not see significant differences between students receiving special and general education. Just over half the students in both special education and general education resided in the seven-county metropolitan area. This analysis did not consider the district in which students were actually enrolled; it is possible that some students who lived outside the metropolitan area attended school in the metropolitan area or vice versa. During the 12-year period we examined, the proportions of students living in the metropolitan area increased slightly among students in both special education and general education.
Grade Level
Grade-Level Distribution of Students Receiving Special Education
As noted earlier in the chapter, there are roughly 112,000 students receiving special education spread among grades kindergarten through 12. We examined the grade level distribution of students receiving special education for the 2010-2011 school year and found the largest numbers of students to be in 12th grade, as shown in Exhibit 2.5. This is unsurprising given that 12th grade logically encompasses the widest age range. Twelfth graders include not just students who graduate at age 17 or 18, but those who remain in school up to age 21.
Exhibit 2.5: Grade Level of Students Receiving Special Education, 2010-2011
[NUMERIC REPRESENTATION OF GRAPHIC]
|
Grade Level |
|
Number of Students |
|
K |
|
6,887 |
|
01 |
|
7,034 |
|
02 |
|
7,316 |
|
03 |
|
8,370 |
|
04 |
|
9,664 |
|
05 |
|
9,631 |
|
06 |
|
9,230 |
|
07 |
|
8,706 |
|
08 |
|
8,595 |
|
09 |
|
8,461 |
|
10 |
|
8,426 |
|
11 |
|
8,190 |
|
12 |
|
11,284 |
NOTES: This exhibit includes public school students receiving special education, as well as nonpublic students who received special education from a public school. “K” represents kindergartners. It should be noted that 12 is the category likely to contain the widest range of student ages. Twelfth graders include not just students who graduate at age 17 or 18, but those who remain in school up to age 21.
SOURCE: Office of the Legislative Auditor, analysis of Minnesota Department of Education’s Child Count data, 2010-2011.
[Sidebar]
Twelfth graders receiving special education include students who remain in school up to age 21.
[End of Sidebar]
Grade Level at Which Students Begin Special Education
As mentioned previously, children in Minnesota are entitled to receive special education services starting at birth. Students can be identified for and placed in special education at any point before or during their K-12 schooling. As discussed in Chapter 1, school districts, along with partnering social service agencies, must conduct “child finds” to locate children who may need special education services, including those who are not yet old enough to enroll in school. School-age children are evaluated for special education when a parent or teacher suspects the child has a disability that is impacting his or her educational attainment. While most of our analysis focused on students in kindergarten through grade 12, we included children from birth through 12th grade in our analysis of the grade at which students first started receiving special education. We analyzed the population of Minnesota students who received special education between the 2001-2002 and 2010-2011 school years, focusing on the grade level at which the student was served for the first time. We found that:
· During the ten-year period, nearly one-third of students identified for special education began receiving services before kindergarten.
The largest group of children in the analysis, by far, consisted of those who started receiving special education before they entered kindergarten—as infants, toddlers, or preschool students. Among students who began receiving special education once they started school, the largest group was first identified for special education as 4th graders, as Exhibit 2.6 shows.
[Sidebar]
Among students who began receiving special education after starting school, the largest group was first identified for special education as 4th graders.
[End of Sidebar]
The number and percentage of children identified for special education before entering kindergarten increased over the ten years examined. In 2001-2002, nearly 5,700 infants, toddlers, and preschoolers started receiving special education (26 percent of children identified that year). By contrast, in the 2010-2011 school year, almost 8,000 children were identified before kindergarten, accounting for 37.2 percent of all students starting special education that year.
We analyzed starting grade levels by disability to determine whether students placed in special education during a given grade level were likely to be classified with a particular disability. We found:
· During the ten-year period examined, students identified for special education in early grades were largely classified as developmentally delayed or with speech or language impairments. In higher grades, specific learning disabilities, emotional or behavioral disorders, and other health disabilities became more prominent.
Between the 2001-2002 and 2010-2011 school years, students tended to be classified with different disabilities depending on the grade level at which they started special education, as demonstrated in Exhibit 2.7. Of students who started receiving special education before kindergarten, more than 90 percent fell into either the categories of developmental delay or speech or language impairments, with developmental delay making up the larger part of the group. About 80 percent of the students placed in special education during kindergarten were assigned to one of those two categories, with the balance shifting toward
Exhibit 2.6: Grade Level at Which Students First Received Special Education, 2001-2002 through 2010-2011
[NUMERIC REPRESENTATION OF GRAPHIC]
|
Grade Level |
|
Number of Students |
|
Pre K |
|
68,488 |
|
K |
|
17,546 |
|
1 |
|
15,054 |
|
2 |
|
16,049 |
|
3 |
|
18,536 |
|
4 |
|
19,849 |
|
5 |
|
13,372 |
|
6 |
|
9,335 |
|
7 |
|
7,764 |
|
8 |
|
7,096 |
|
9 |
|
6,791 |
|
10 |
|
5,687 |
|
11 |
|
4,285 |
|
12 |
|
3,320 |
NOTES: This exhibit includes public school students receiving special education, as well as nonpublic students who received special education from a public school. “Pre K” encompasses infants, toddlers, and preschool students receiving special education; “K” represents kindergartners. Data reflect all students who received special education between the 2001-2002 and 2010-2011 school years, assigned to the grade level in which they received special education for the first time. The 1999-2000 and 2000-2001 school years were excluded from this exhibit due to the likelihood that students appearing in our data for the first time in those years could have started receiving special education during an earlier year.
SOURCE: Office of the Legislative Auditor, analysis of Minnesota Department of Education’s Child Count data, 2001-2002 through 2010-2011.
speech. Among students first identified in 1st grade, only a small percentage of the new students were classified as developmentally delayed.[7] About half of the students identified in 1st grade had speech or language impairments, while sizable percentages of students were identified with emotional or behavioral disorders or specific learning disabilities.
[Sidebar]
About half of the students identified for special education in 1st grade had speech or language impairments.
[End of Sidebar]
Race and Ethnicity
Historically, Minnesota’s K-12 student population, both special and general education, has been predominantly white. Our analysis of student race and ethnicity shows, however, that since 1999-2000, the proportions of minority students have increased in both general and special education. We found:
· The percentage of minority students rose somewhat more in special education than it did in general education.
Exhibit 2.7: Disability Category Placements by Grade Level at Which Students First Received Special Education, 2001-2002 through 2010-2011
[NUMERIC REPRESENTATION OF GRAPHIC]
|
|
Grade Level |
|||||||||||||
|
Pre K |
K |
1 |
2 |
3 |
4 |
5 |
6 |
7 |
8 |
9 |
10 |
11 |
12 |
|
|
Autism spectrum disorders |
5.3% |
6.0% |
5.5% |
4.9% |
3.2% |
2.8% |
3.2% |
3.6% |
4.4% |
3.1% |
2.9% |
2.4% |
2.2% |
3.1% |
|
Developmental delay |
60.0 |
33.6 |
5.1 |
0.0 |
0.0 |
0.0 |
0.0 |
0.0 |
0.0 |
0.0 |
0.0 |
0.0 |
0.0 |
0.0 |
|
Emotional or behavioral disorders |
0.8 |
4.8 |
12.3 |
14.5 |
12.0 |
10.3 |
14.9 |
20.8 |
28.0 |
33.0 |
35.8 |
36.4 |
33.0 |
28.0 |
|
Other health disabilities |
0.3 |
1.9 |
5.3 |
9.1 |
10.3 |
10.2 |
13.7 |
19.0 |
21.5 |
25.2 |
22.7 |
22.1 |
23.8 |
20.1 |
|
Specific learning disabilities |
0.0 |
1.9 |
15.7 |
34.3 |
38.1 |
31.2 |
32.2 |
33.7 |
31.5 |
28.0 |
28.9 |
29.5 |
30.2 |
30.8 |
|
Speech or language impairments |
31.3 |
47.2 |
49.8 |
32.1 |
32.7 |
42.6 |
32.3 |
17.9 |
8.9 |
5.0 |
3.3 |
2.7 |
2.9 |
2.4 |
|
All not light green (low incidence) |
2.3 |
4.6 |
6.2 |
5.1 |
3.7 |
3.0 |
3.8 |
5.1 |
5.7 |
5.7 |
6.5 |
7.0 |
7.8 |
15.7 |
NOTES: This exhibit includes public school students receiving special education, as well as nonpublic students who received special education from a public school. “Pre K” encompasses infants, toddlers, and preschool students receiving special education; “K” represents kindergartners. Data reflect all students who received special education between the 2001-2002 and 2010-2011 school years, assigned to the grade level and disability category in which they received special education for the first time. The 1999-2000 and 2000-2001 school years were excluded from this exhibit due to the likelihood that students appearing in our data for the first time in those years could have started receiving special education during an earlier year. The highest-incidence categories are broken out above. “All other disability categories” includes deaf-blind, deaf and hard of hearing, developmental cognitive disabilities, physically impaired, severely multiply impaired, traumatic brain injury, and visually impaired.
SOURCE: Office of the Legislative Auditor, analysis of Minnesota Department of Education’s Child Count data, 2001-2002 through 2010-2011.
In the 1999-2000 school year, minority students made up about 17 percent of the general student population, increasing to 26 percent in 2010-2011. The share of minority students receiving special education increased from almost 19 percent of the special education population at the beginning of the period to 30 percent by the end. Over the time period examined, the number of minority students in general education increased from almost 131,000 to almost 188,000—a 44‑percent increase. Minority students receiving special education increased from almost 22,000 to almost 38,000 students—a 75-percent increase over the time period examined.
[Sidebar]
From 1999-2000 to 2010-2011, the number of minority students receiving special education increased 75 percent.
[End of Sidebar]
The populations of both special and general education are becoming more diverse. Exhibit 2.8 gives more detail on the growing proportions of minority students, as well as the corresponding decline in the proportion of white students, in both special and general education. All minority groups had a higher share of students identified for special education in 2010-2011 than they did in 1999-2000, but certain racial and ethnic groups (specifically black and Hispanic students) have seen larger increases than other groups relative to the general education population.
Exhibit 2.8: Percentages of Students Belonging to Racial and Ethnic Groups, 1999-2000 and 2010-2011
|
General Education |
Special Education |
|||
|
1999-2000 |
2010-2011 |
1999-2000 |
2010-2011 |
|
|
|
|
|
|
|
|
American Indian or Alaskan Native |
2.0% |
2.1% |
3.6% |
4.0% |
|
Asian or Pacific Islander |
5.3 |
7.0 |
2.8 |
4.2 |
|
Hispanic |
3.3 |
6.9 |
3.2 |
7.7 |
|
Black (not Hispanic) |
6.4 |
9.7 |
9.2 |
14.1 |
|
White (not Hispanic) |
83.0 |
74.3 |
81.2 |
69.9 |
NOTES: This exhibit includes public school students in kindergarten through grade 12, as well as nonpublic students in those grades who attended a public school part time. “Special education” refers to students who received special education at any point during the applicable school year. “General education” refers to the remaining students who did not participate in special education during that year.
SOURCE: Office of the Legislative Auditor, analysis of Minnesota Department of Education’s Minnesota Automated Reporting Student System data, 1999-2000 and 2010-2011.
[Sidebar]
Of the 13 disability categories, only in the category of autism spectrum disorders did white students have higher rates of enrollment than all groups of minority students.
[End of Sidebar]
We examined student race and ethnicity to determine whether students in certain racial or ethnic groups were disproportionately represented in special education. Almost one-quarter of American Indian students and 20 percent of black students received special education in 2010-2011, compared with about 14 percent of white students. When we analyzed race and ethnicity by disability category, we found:
· In 2010-2011, American Indian students and black students were more likely than students on the whole to be placed in most of the higher-incidence disability categories.
Black students and American Indian students were more often identified with emotional or behavioral disorders, developmental cognitive disabilities, and other health disabilities than students of other races. For instance, 6.3 percent of all American Indian students received special education for an emotional or behavioral disorder, as compared with 2.2 percent of all K-12 students. Additionally, black, American Indian, and Hispanic students all had high incidences of specific learning disabilities. Only in the category of autism spectrum disorders did white students have the highest identification rate. Exhibit 2.9 shows the different racial and ethnic groups and the percentages of each group’s students that were placed in each of the 13 disability categories during the 2010-2011 school year.
Exhibit 2.9: Statewide Enrollment Rates of Racial and Ethnic Groups in Special Education, by Primary Disability Category, 2010-2011
|
American Indian or Alaskan Native |
Black |
Hispanic |
Asian or Pacific Islander |
White |
All Students |
|
|
|
|
|
|
|
|
|
|
No Disability |
75.1% |
80.1% |
83.8% |
90.6% |
86.1% |
85.3% |
|
Autism spectrum disorders |
1.2 |
1.2 |
1.0 |
1.1 |
1.9 |
1.7 |
|
Deaf-blind |
<0.1 |
<0.1 |
<0.1 |
<0.1 |
<0.1 |
<0.1 |
|
Deaf and hard of hearing |
0.2 |
0.3 |
0.4 |
0.5 |
0.2 |
0.3 |
|
Developmental cognitive disabilities |
2.0 |
1.7 |
1.0 |
0.7 |
1.0 |
1.1 |
|
Developmental delay |
0.9 |
0.4 |
0.6 |
0.2 |
0.3 |
0.3 |
|
Emotional or behavioral disorders |
6.3 |
5.0 |
1.6 |
0.5 |
1.9 |
2.2 |
|
Other health disabilities |
3.2 |
2.6 |
1.6 |
0.6 |
2.3 |
2.2 |
|
Physically impaired |
0.2 |
0.2 |
0.2 |
0.2 |
0.2 |
0.2 |
|
Severely multiply impaired |
0.2 |
0.2 |
0.2 |
0.1 |
0.1 |
0.1 |
|
Specific learning disabilities |
7.3 |
6.4 |
7.1 |
3.2 |
3.4 |
4.1 |
|
Speech or language impairments |
3.1 |
1.9 |
2.5 |
2.3 |
2.6 |
2.5 |
|
Traumatic brain injury |
0.1 |
0.1 |
<0.1 |
<0.1 |
0.1 |
0.1 |
|
Visually impaired |
0.1 |
<0.1 |
<0.1 |
<0.1 |
<0.1 |
<0.1 |
NOTES: This exhibit includes public school students in kindergarten through grade 12, as well as nonpublic students in those grades who attended a public school part time. The numbers in this exhibit reflect the percentage of each racial and ethnic group of students receiving special education in each disability category. For instance, of all the black students statewide, 1.2 percent had autism spectrum disorders as their primary disability. This is slightly lower than the statewide average shown in the final column. Note that while students may have more than one disability, they are classified according to their “primary disability”—that which most impacts the student’s academic functioning.
SOURCE: Office of the Legislative Auditor, analysis of Minnesota Department of Education’s Minnesota Automated Reporting Student System data, 2010-2011.
[Sidebar]
The Minnesota Department of Education found that racial disproportionality in special education is not a result of mislabeling minority students.
[End of Sidebar]
Although our analysis makes clear that some minority groups are overrepresented in special education, the Minnesota Department of Education (MDE) found that the disproportionality is not a result of the mislabeling of minority students. MDE reports to the federal government on the percentage of school districts and charter schools that exhibit disproportionately high or low representation of minority students receiving special education as a result of inappropriate identification practices. To do so, the department has determined a data threshold representing an acceptable amount of disproportionality. MDE must first perform calculations to determine whether individual school districts and charter schools exceed the established threshold for whether a minority group is over or underrepresented in special education. Second, MDE must determine through its monitoring process whether the disproportionality resulted from inappropriate identification processes. In 2010-2011, MDE found that only a handful of school districts and charter schools met the data threshold for significant disproportionality—either overall or within a particular disability category—and that none had inappropriate identification practices.
Instructional Settings
School-age students receiving special education are assigned to an instructional setting, depending on the percentage of the school day they spend outside the general education classroom. Students age 6 to 21 are placed in one of eight possible instructional settings—known by the numbers one through eight—with one being the least restrictive setting and eight being the most restrictive.[8] Specific classrooms or programs that cater to students in a certain instructional setting are often identified using that setting number. For example, in common parlance, a school dedicated to serving students with disabilities outside of the traditional school might be known as a “setting-four program.” As explained in Chapter 1, federal law requires local education agencies to educate students with disabilities with their nondisabled peers to the maximum extent appropriate, meaning that every student in special education should be placed in his or her least restrictive appropriate setting.[9] The eight instructional settings are described in Exhibit 2.10.
We analyzed data relating to students’ instructional settings and found:
· In the 2010-2011 school year, more than 60 percent of students receiving special education spent most of their school day in the general classroom (setting one).
During the 2010-2011 school year, the majority of students receiving special education spent less than 21 percent of their school day outside the general classroom (this is known as setting one), with fewer students served in each more restrictive setting. This general pattern has held true since 1999-2000, as shown in Exhibit 2.11. The changes in the setting distribution over time have been subtle. Between the 1999-2000 and 2010-2011 school years, the proportion of students in the least and most restrictive settings decreased slightly, accompanied by slight increases in the shares of students in settings two and three.
[Sidebar]
The Minnesota Department of Education found that racial disproportionality in special education is not a result of mislabeling minority students.
[End of Sidebar]
Each primary disability category has its own distinct distribution of instructional settings. For example, during the 2010-2011 school year, 97 percent of students with speech or language impairments as their primary disability received special education in the least restrictive setting (setting one). At least 70 percent of all students classified as deaf and hard of hearing, visually impaired, or developmentally delayed received special education in the least restrictive setting as well. Students who were severely multiply impaired were not likely to be served in setting one. Almost two-thirds of those students received special education in a self-contained special education classroom within a traditional school (setting three). The remaining disability categories tended to be fairly mixed, with students receiving special education in many possible settings.
Exhibit 2.10: Special Education Instructional Settings
|
Instructional Setting |
Time Spent Outside the General Classroom or Traditional School |
Description |
|
|
|
|
|
One |
Less than 21 percent outside general classroom |
Students spend most of their time in a general classroom but may receive special education outside of the general classroom for less than 21 percent of the school day. A student might, for example, spend his entire day in a general classroom but receive special education within that classroom. Alternately, the student may spend most of the day in a general classroom, but receive some special education at a separate location, such as a resource room. |
|
|
|
|
|
Two |
From 21 to 60 percent outside general classroom |
Students receive special education outside their general classroom for at least 21 but not more than 60 percent of the school day. This includes students placed in resource rooms with part-time instruction provided in a general classroom. Setting two might also include students who receive services at a separate special education facility for up to half the school day but spend the rest of the day in the general classroom. |
|
|
|
|
|
Three |
More than 60 percent outside general classroom |
Students receive special education outside the general classroom for more than 60 percent of the school day. These students spend most or all of their school day in contained special education classrooms that are located on traditional school campuses. A traditional high school, for example, may have a “setting-three classroom” where certain disabled students receive full-time or nearly full-time special education instruction. This setting does not apply to students who attend separate day or residential facilities for more than half the school day but could apply to students who spend more than 60 percent of their day in a combination of offsite and on-site special education programming. |
|
|
|
|
|
Four |
More than 50 percent outside of traditional school |
Students receive special education for more than half the school day in separate public day facilities. This includes students who attend public day schools for students with disabilities on a full-time basis. It also includes students who spend at least half their school day in a public day school for students with disabilities and the rest of their time in a traditional school. A “setting-four program” is typically an entire school building dedicated to serving students with disabilities, most on a full-time basis. |
|
|
|
|
|
Five |
More than 50 percent outside of traditional school |
Students receive special education for more than half the school day in separate private day facilities (at public expense). This is similar to setting four, but with the separate day school being private rather than public.a |
|
|
|
|
|
Six |
More than 50 percent outside of traditional school |
Students receive special education for more than half the school day in public residential facilities. This includes students who spend their entire school day in a residential school for students with disabilities, as well as students who spend more than half their day in such a school and the rest of their time in a traditional school. |
|
|
|
|
|
Seven |
More than 50 percent outside of traditional school |
Students receive special education for more than half the school day in private residential facilities (at public expense). This is similar to setting six, but with the residential facility being private rather than public.a |
|
|
|
|
|
Eight |
100 percent outside traditional school |
Students receive special education in a hospital or homebound program. |
NOTES: The eight instructional settings apply to students age 6 to 21 in kindergarten through grade 12. A “general classroom” is a kindergarten, elementary, or secondary classroom that is not dedicated to serving students with disabilities. Similarly, a “traditional school” is an elementary or secondary school not specifically dedicated to serving students with disabilities. General classrooms and traditional schools are sometimes referred to as “regular” or “mainstream” classrooms and schools.
a A student may be placed in a private facility (either day or residential) by the courts, the Department of Human Services, or a school district, particularly when there is no nearby public school option suited to the student’s needs.
SOURCE: Minnesota Department of Education, Division of Program Finance, Special Education Instructions on Reporting Child Count, December 1, 2011, 6-7.
Exhibit 2.11: Students Receiving Special Education by Instructional Setting, 1999-2000 and 2010-2011
|
|
1999-2000 |
2010-2011 |
||
|
|
N |
% |
N |
% |
|
|
|
|
|
|
|
Setting onea |
64,618 |
64% |
66,068 |
61% |
|
Setting twob |
21,889 |
22 |
26,005 |
24 |
|
Setting threec |
8,255 |
8 |
11,097 |
10 |
|
Settings four and fived |
4,185 |
4 |
4,178 |
4 |
|
Settings six through eighte |
1,340 |
1 |
387 |
<1 |
|
Total |
100,287 |
100% |
107,735 |
100% |
NOTES: This exhibit includes public school students predominantly between the ages of 6 and 21 in kindergarten through grade 12, as well as nonpublic students of those ages and grade levels who attended a public school part time. Data reflect students receiving special education services as of December 1 of the appropriate school year. They do not include students who exited special education prior to December 1, or those who began receiving special education service later in the school year. Percent columns may not sum to 100 due to rounding.
a Setting one is for students who spend all or most of their school day in the general classroom.
b Setting two is for students who spend from 21 to 60 percent of their school day outside the general classroom, often visiting a resource room for part of the day.
c Setting three is for students who spend more than 60 percent of the school day in a contained special education classroom within a traditional school.
d Settings four and five are combined in this exhibit because they are similar settings. They are equally restrictive—in each, students spend more than half their school day in a separate day facility—and differ only in whether the facility is publicly or privately owned.
e Settings six through eight are combined because they are the three most restrictive settings. They include separate residential programs catering to students receiving special education (both public and private) and hospital and homebound programs.
SOURCE: Office of the Legislative Auditor, analysis of Minnesota Department of Education’s Unduplicated Child Count data, 1999-2000 and 2010-2011.
The federal government requires MDE to set targets for and report on the percentages of students receiving special education in settings one, three, and the combined settings four through eight.[10] Accordingly, MDE set the goal that during the 2010-2011 school year, 62.5 percent or more of students receiving special education would spend most of their school day in the general classroom (setting one). Since federal regulations emphasize including students in the general classroom to the greatest extent appropriate, the targets for setting three and settings four through eight are much lower and represent ceilings that the state hopes not to exceed. Over the past several years, the state has failed to meet its targets for settings one and three, but typically has stayed under the established ceiling for percentage of students in settings four through eight.
Minnesota compares favorably to other states in percentages of students in each instructional setting. Students must be educated with their nondisabled peers to the greatest extent possible, making high percentages of students in settings one and two preferable.[11] Minnesota’s 2010-2011 percentage of 61 percent in setting one is about the same as the national average, and its setting-two rate is 4‑percentage points higher than the national average. Minnesota’s percentage for the more restrictive setting three is four points lower than the national average.[12]
[Sidebar]
In Minnesota, 61 percent of students receiving special education did so while in the general education classroom, which was comparable to the national average.
[End of Sidebar]
Success of Students Receiving Special Education
We consulted a number of sources to determine how well students receiving special education are performing. We analyzed a sampling of individualized education programs (IEPs) and progress reports to determine the extent to which students receiving special education met their stated goals and short-term objectives. We evaluated the extent to which students moved to less restrictive instructional settings, either by meeting their IEP goals and leaving special education or by moving to a less restrictive special education environment. Finally, we studied the data that MDE uses to address student results indicators in its annual performance report to the federal U.S. Department of Education.
IEP Goals
As touched on in Chapter 1, each student in special education must have a written plan, known as an IEP, which includes measurable annual goals and at least two short-term objectives or benchmarks for each goal to demonstrate that the student is making progress toward the goal. The content of the IEP is determined by an IEP team, which consists of at least one of the student’s general education teachers, at least one special education teacher or special education service provider, an administrative designee who is qualified to oversee the provision of services to students with disabilities, and the student’s parents, among others.[13] Minnesota rules require that IEP teams evaluate students’ needs and revise their IEP goals at least once per year.[14]
MDE does not have centralized data on IEP goals and short-term objectives and whether students meet them. The IEP analysis we conducted was based on a random sample of IEPs collected as part of our case studies of eight local education agencies (LEAs).[15] From each LEA, we requested a small number of IEPs written during the 2010-2011 school year, along with the progress reports that address the goals in those IEPs.[16] While the results of our analysis are not generalizable, the sample we collected (137 IEPs from eight LEAs) allowed us to become familiar with the content of IEPs and progress reports, and to get a general sense of whether these students receiving special education were meeting the goals and short-term objectives laid out in their IEPs. We found:
· Among the sample of IEPs we reviewed, students receiving special education met relatively few of their annual goals and short-term objectives.
The sample of 137 IEPs we reviewed contained 447 annual goals and 1,376 related short-term objectives. On average, each IEP contained about three goals and ten short-term objectives. We found that 8 percent of the overall goals were met by the final progress report we reviewed.[17] We determined that 79 percent of the goals were not met, and we were unable to make a determination regarding the remaining 13 percent. Of those that were not met, progress reports indicated that the students were making progress for 88 percent of the goals we examined.
[Sidebar]
In a small sample of 137 students, we found that only 8 percent of students’ 447 goals had been met by the end of a school year; but students made progress on 88 percent of the unmet goals.
[End of Sidebar]
The short-term objectives were more difficult to analyze because teachers are not required to address them specifically in progress reports. We ascertained that 28 percent of short-term objectives were met or partially met and 48 percent were not met. Almost a quarter of the short-term objectives, however, were either not addressed in the progress report narrative, or described in a manner that made it unclear whether or not the objective had been accomplished. Of those short-term objectives we could definitively classify as not met, progress was evident in 44 percent of cases.
Change in Instructional Setting
As discussed earlier in this chapter, a student’s instructional setting is an indication of the percentage of the student’s school day spent in general versus special education. We used instructional setting data to determine the extent to which students receiving special education returned to less restrictive settings after they started receiving special education. Since students must be served in the least restrictive appropriate environment, it stands to reason that a student moving from a more restrictive special education setting to a less restrictive setting would be a sign of progress.
We analyzed K-12 students age 6 to 21 who received special education (in settings one through eight) between the 1999-2000 and 2009-2010 school years. We found:
· In an average school year between 1999-2000 and 2009-2010, 17 percent of all students receiving special education moved to a less restrictive setting.
[Sidebar]
By law, students receiving special education are to be served in the least restrictive environment that is appropriate to their needs—that is, with their nondisabled peers.
[End of Sidebar]
The percentage of students who moved to a less restrictive setting averaged 17 percent per year and fluctuated slightly over the period we examined. Exhibit 2.12 shows the percentages of students who moved to a less restrictive environment over the course of a school year (or by the beginning of the next), either by exiting special education completely or by moving to a less restrictive setting for special education instruction.[18] A larger portion of students receiving special education who returned to a less restrictive setting did so by exiting special education completely. These students received special education during a given year, but then had their IEPs terminated.[19] When an IEP is terminated, the student no longer receives special education services.
Annual Performance Report Results
As discussed briefly in Chapter 1, every year MDE must produce an annual performance report, as required by the U.S. Department of Education’s Office of Special Education Programs. The document reports on the state’s progress with respect to a set of federally determined performance indicators. MDE has developed a state performance plan (discussed further in Chapter 4), which discusses 20 indicators and how Minnesota will measure and improve on its performance in those areas. As part of the performance plan, MDE worked with the state’s Special Education Advisory Panel to develop “measureable and rigorous targets” for each indicator.[20] We reviewed annual performance report data and found:
· Minnesota has achieved its goals with respect to many, but not all, annual performance report results indicators.
[Sidebar]
Majorities of students receiving special education who moved to less restrictive settings did so by virtue of exiting special education altogether.
[End of Sidebar]
Exhibit 2.12: Students Receiving Special Education Who Moved to a Less Restrictive Setting, 1999-2000 through 2009-2010
[NUMERIC REPRESENTATION OF GRAPHIC]
|
1999-2000 |
2000-2001 |
2001-2002 |
2002-2003 |
2003-2004 |
2004-2005 |
2005-2006 |
2006-2007 |
2007-2008 |
2008-2009 |
2009-2010 |
|
|
Exited special education |
10% |
11% |
10% |
9% |
10% |
10% |
9% |
9% |
9% |
9% |
8% |
|
Moved to a less restrictive special education setting |
7 |
8 |
7 |
8 |
7 |
9 |
8 |
8 |
7 |
7 |
7 |
NOTES: This exhibit includes public school students predominantly between the ages of 6 and 21 in kindergarten through grade 12, as well as nonpublic students of those ages and grade levels who attended a public school part time. The percentage of students for each school year is equal to the number of students who moved to a less restrictive instructional setting by the end of the applicable year or the beginning of the next school year divided by the total number of students who received special education services in that school year. Note that students who “exited special education” and students who “moved to a less restrictive special education setting” are subsets of students who “moved to a less restrictive setting.”
SOURCE: Office of the Legislative Auditor, analysis of Minnesota Department of Education’s Minnesota Automated Reporting Student System data, 1999-2000 through 2009-2010.
In this section, we discuss some of the indicators that best demonstrate student results: graduation and drop-out rates, standardized testing, and postsecondary outcomes. Compliance indicators are discussed in Chapter 4.[21]
[Sidebar]
Some students receiving special education can graduate by meeting their IEP goals.
[End of Sidebar]
Graduation and Drop-Out Rates
In Minnesota, students receiving special education can graduate in one of two ways: either by meeting the graduation standards established by their school district or by satisfying the goals and objectives in their IEPs.[22] A student’s IEP team decides whether a student is eligible to work towards an IEP-driven diploma. Since the 2004-2005 school year, MDE has collected data and reported to the federal government on the “percent of youth with IEPs graduating from high school with a regular diploma.” [23] Since MDE began reporting graduation rates for students receiving special education in its annual performance report, Minnesota’s statewide graduation rates for students receiving special education have exceeded the state’s targets. In the 2009-2010 school year (most recent year reported), 87 percent of graduation-eligible students receiving special education graduated, surpassing the statewide target of 85 percent. Exhibit 2.13 shows the target and actual graduation rate for students receiving special education over the past several years.
[Sidebar]
In the 2009-2010 school year, 87 percent of graduation-eligible students receiving special education did graduate; 4.2 percent of students in special education dropped out of school.
[End of Sidebar]
As with graduation rates, MDE
has established targets for and reported on drop-out rates for students
receiving special education. Since a very low drop-out rate is the
desired outcome, MDE’s targets serve as a ceiling, rather than a target to exceed.
Minnesota’s statewide drop-out rates for students receiving special
education have gradually decreased over time, remaining very close to the
MDE-established target rates. As Exhibit 2.14 shows, between the
2004-2005 and 2009-2010 school years, statewide drop-out rates exceeded targets
in three of the years, but stayed below the ceiling in the other three.
In each of the years, the observed drop-out rate was very close to the target
rate, within 0.3-percentage points. In the 2009-2010 school year, for instance,
Minnesota’s special education drop-out rate of 4.2 percent was just barely
better than the 4.3-percent target.
Standardized Tests
As part of its annual performance report, MDE must report on the percentage of students receiving special education who participate in standardized assessments, as well as the percentage that demonstrate proficiency on those assessments. All Minnesota students must take the Minnesota Comprehensive Assessments (MCAs) in both reading and math every year from grades 3 through 8.[24] Students must also take a final reading assessment in 10th grade and a math assessment in 11th grade.
[Sidebar]
Graduation rates among students receiving special education exceeded targets set for each school year from 2004-2005 through 2009-2010.
[End of Sidebar]
Exhibit 2.13: Graduation Rates for Students Receiving Special Education, 2004-2005 through 2009-2010
[NUMERIC REPRESENTATION OF GRAPHIC]
|
|
School Year |
|||||
|
2004-2005 |
2005-2006 |
2006-2007 |
2007-2008 |
2008-2009 |
2009-2010 |
|
|
Statewide target |
81.6% |
82.1% |
82.2% |
80.0% |
85.0% |
85.0% |
|
Statewide graduation rate |
82.4% |
84.6% |
84.9% |
84.9% |
85.3% |
86.6% |
SOURCE: Office of the Legislative Auditor, analysis of Minnesota Department of Education’s annual performance report data, 2004-2005 through 2009-2010.
Students with IEPs can participate in standardized assessments in a number of ways. In 2010-2011, almost 80 percent of students receiving special education took the standard statewide assessments, either with or without accommodations (such as extra time allowed or different presentation format or response mode). Another 8 to 9 percent of students receiving special education took the MCA-Modified assessment, which is based on modified achievement standards and used for persistently low-performing students whose IEPs are based on grade-level content standards.[25] Just over 10 percent of students receiving special education took the Minnesota Test of Academic Skills, which is measured against alternate achievement standards and administered to students whose cognitive functioning is well below age expectations. The decision about which type of assessment is most appropriate is made by a student’s IEP team.
Exhibit 2.14: Drop-Out Rates for Students Receiving Special Education, 2004-2005 through 2009-2010
[NUMERIC REPRESENTATION OF GRAPHIC]
|
|
School Year |
|||||
|
2004-2005 |
2005-2006 |
2006-2007 |
2007-2008 |
2008-2009 |
2009-2010 |
|
|
Statewide target |
4.6% |
4.5% |
4.4% |
4.4% |
4.3% |
4.3% |
|
Statewide drop-out rate |
4.9% |
4.2% |
4.5% |
4.5% |
4.2% |
4.2% |
NOTES: Statewide drop-out rate targets are determined by the Minnesota Department of Education in cooperation with the state Special Education Advisory Panel. The statewide drop-out target is a ceiling and it is desirable that rates do not exceed it.
SOURCE: Office of the Legislative Auditor, analysis of Minnesota Department of Education’s annual performance report data, 2004-2005 through 2009-2010.
[Sidebar]
At least 96 percent of students receiving special education at particular grade levels participated in standardized assessments each year since 2006-2007, which exceeded state-set targets for participation.
[End of Sidebar]
Since the 2005-2006 school year, Minnesota’s goal for special education participation in standardized assessments (of any of the varieties described above) has ranged from 95 to 96 percent. Department data show that the state has typically exceeded its goals, with at least 96 percent of special education students in the appropriate grades participating in standardized assessments every year since 2006-2007.[26]
With respect to proficiency on standardized assessments, MDE has established different target rates for each subject and grade level; the 2010-2011 targets ranged from about 80 to 84 percent in reading and 60 to 88 percent in math. The department reports that in 2010-2011, Minnesota did not meet the proficiency targets for any grade level in either reading or math. However, the data in MDE’s 2010-2011 Annual Performance Report show that overall proficiency rates for students receiving special education have been generally improving since the 2006-2007 school year.[27]
[Sidebar]
Students receiving special education did not meet proficiency targets for standardized assessments in any grade level for either reading
or math in 2010-2011.
[End of Sidebar]
Postsecondary Outcomes
As part of its annual performance report, MDE examines outcomes related to students receiving special education after they leave secondary school. The 2010-2011 school year was the first year that MDE reported the current set of three outcomes, which includes the “percent of youth, who are no longer in secondary school, had IEPs in effect at the time they left school, and were: (a) enrolled in higher education within one year of leaving high school, (b) enrolled in higher education or competitively employed within one year of leaving high school, or (c) enrolled in higher education or in some other postsecondary education or training program, or competitively employed or in some other employment within one year of leaving high school.”[28] MDE collected data on postsecondary attainment through a telephone survey administered by school districts and charter schools selected for participation in MDE’s monitoring process. (Monitoring is discussed further in Chapter 4.) In the spring of 2011, MDE collected 567 responses to its survey.
Based on these survey responses, MDE determined that former students in special education slightly exceeded the state targets set for each of the three measured postsecondary outcomes. The statewide rate of youth enrolled in higher education was 33 percent, exceeding the target of 29 percent. The statewide rate of youth enrolled in higher education or competitively employed was 63 percent, exceeding the target rate of 62 percent. Finally, the statewide rate of youth enrolled in any type of postsecondary education or training or employed in any capacity was 80 percent, which exceeded the target rate of 78 percent.
Cost Implications of Student Characteristics
Some of the data presented in this chapter have direct implications for the costs of the special education system. As Chapter 3 will discuss in more detail, special education students are more expensive to serve than general education students, and two of the major cost drivers in special education are the needs of the students and staffing. We did not attempt to quantify costs associated with changes in student characteristics over time, but we wish to note some student trends with potential cost implications before moving into a more detailed discussion of the costs of special education in Chapter 3. Overall, the number of students receiving special education has increased steadily, suggesting that the number of K-12 students receiving special education—and the costs of special education—will continue to increase.[29]
[Sidebar]
As the numbers of K-12 students receiving special education increase, costs will also continue to increase.
[End of Sidebar]
Earlier in this chapter, we showed that the distribution of students in the 13 disability categories has changed over time. This is relevant because some disabilities result in higher special education expenditures than others. For example, Exhibit 2.3 shows that the number of students with autism spectrum disorders increased dramatically during the 12-year period examined. Among the five highest-incidence disability categories during the 2008-2009 school year, autism spectrum disorders were the second most expensive on a per student basis. While the rate of growth has slowed over time, the number of students identified with autism spectrum disorders increased by more than 800 students per school year over 10 of 11 years. Even with a slower pace of growth, as long as the influx of students with autism spectrum disorders continues, statewide special education costs will likely increase as well.
Finally, special education tends to becomes more costly to provide as the instructional setting becomes more restrictive, largely due to the increased staff required. A student who receives special education mostly inside the general classroom incurs relatively little extra cost because the general education teacher is already there and would be whether or not the student was identified for special education. When students leave the general classroom to see specialists, or spend their school days in self-contained special education classrooms or programs, more and more staff become necessary, adding to salary costs. In settings three (self-contained special education classroom) and four (separate schools for students receiving special education), class sizes are relatively small and teachers may be assisted by multiple paraprofessionals. With respect to instructional settings, we observed (1) a slight shift in the proportion of students from the least restrictive setting to settings two and three, and (2) a small percentage of students moving to less restrictive settings or exiting special education completely. It is unclear whether the shifts we observed have been significant enough to impact special education costs overall. It is clear, however, that student disabilities and instructional settings have the potential to drive costs higher, especially if dramatic changes were to occur.
[1] In this chapter, we use “special education” in place of the phrase “special education instruction and related services,” unless the context requires a distinction between instruction and related services.
[2] The student enrollment data reported in this chapter include a small number of students (fewer than 7,000) who were enrolled part time in a Minnesota public school, but were otherwise nonpublic students attending private, sectarian, or home schools.
[3] The result is a percentage somewhat lower than that presented in the previous paragraph, which reflects students receiving special education as a proportion of the K-12 public school population, rather than all eligible school-age students. Also, for the federal data reported, the school-eligible population includes students age 6 to 21; this is slightly different from the K-12 population, which include some 5-year olds.
[4] Note that states can establish their own eligibility criteria for special education classification. We are unable to determine whether the states with lower percentages of students receiving special education (1) actually have fewer students with disabilities or (2) have more stringent identification criteria.
[5] Minnesota Department of Education, Minnesota Automated Reporting Student System Manual (Roseville, MN, 2012), 88.
[6] Based strictly on percentage change, the most growth occurred in the number of severely multiply impaired students. The number of students involved, however, was much smaller.
[7] Minnesota statutes limit the developmental delay category to students age seven years and younger. Minnesota Statutes 2012, 125A.02, subd.1a.
[8] There are many additional instructional settings (numbered 11 and higher) for students younger than age six, and five-year-old students in kindergarten may have one of these additional settings. However, since the bulk of special education students in kindergarten through 12th grade are older than five, we focused our analysis on those students enrolled in one of the first eight instructional settings. Therefore, while we typically refer to our universe of public school students as the K-12 student population, when specifically discussing instructional settings, we will only be describing students age 6 through 21, a group comprising most, but not all, K-12 students.
[9] 34 CFR sec. 300.114 (2012).
[10] MDE worked with the state’s Special Education Advisory Panel to set instructional setting targets. Targets were based on baselines established in 2004-2005 and generally become more stringent as time goes on.
[11] 34 CFR sec. 300.114 (a)(2)(i)-(ii) (2006). At the same time, a placement in instructional settings one or two is not necessarily preferable for every individual student. The nature and severity of some students’ disabilities make separate classes or schools the most appropriate option, and consequently, the least restrictive appropriate settings for those students.
[12] Differences in the ways states collect data make it difficult to determine exact percentages for the more restrictive settings, but it appears that Minnesota’s rates are slightly lower than average for settings four through eight as well.
[13] Minnesota Rules 2012, chapter 3525.2810, subp. 1(B).
[14] Ibid., subps. 2 and 3(A).
[15] The LEAs we visited included two independent school districts, one charter school, two special education cooperatives, one service cooperative, one education district, and one intermediate district. We selected LEAs based on factors such as size, type, and geographic distribution. Further information about the eight LEAs selected as case studies can be found in Appendix A.
[16] The progress reports associated with IEPs written in 2010-2011 could have been from either the 2010-2011 or 2011-2012 school year. While we requested progress reports for the full year after the IEP in question, they were not always available.
[17] It should be noted that the students included in this analysis were disproportionately likely to be in a restrictive setting. In our effort to visit a variety of LEAs, five of our eight visits were with cooperative entities such as intermediate districts or special education cooperatives. Students who attend such cooperative entities full time tend to be placed in instructional settings three or four. Cooperative entities may provide part-time special education to students in settings one or two, but for the most part, those students’ IEPs are written by and maintained in the student’s school district or charter school.
[18] For the purposes of this analysis, we considered a student’s most restrictive setting during a given school year and compared it with the student’s setting at the beginning of the next school year. We used the first record in the following school year as our end point to capture students who changed settings over the summer or immediately upon returning to school the next school year. If there were no records in the following school year, we used the last record of the school year we were analyzing.
[19] IEPs are typically terminated for one of two reasons: (1) the student met his or her IEP goals and no longer required special education, or (2) the student’s parent chose to withdraw the student from special education. Our data do not indicate which of these scenarios led to the IEP termination for a given student.
[20] Targets were generally established using 2004-2005 or 2005-2006 baseline data and become more stringent over time. The earliest data reported in this section are from the 2005-2006 school year. In some cases, we report fewer years of data because the indicator was established more recently.
[21] More information on any of the annual performance report indicators can be found in Minnesota’s most recent annual performance report submission, Minnesota Part B Annual Performance Report (APR) (Roseville, MN, 2012), available at MDE’s Web site, http://education.state.mn.us/MDE/SchSup/SpecEdComp/index.html.
[22] In Minnesota, all diplomas are regular diplomas granted at the local school district level; there is no state diploma, and there is no alternative to a regular diploma. According to Minnesota Statutes 2012, 125A.04, “a pupil with a disability who satisfactorily attains the objectives in the pupil’s individualized education program must be granted a high school diploma that is identical to the diploma granted to a pupil without a disability.” Special education graduation rates include students who graduate by satisfying IEP goals as well as by meeting local graduation requirements.
[23] For the purposes of the annual performance report, graduation rate is calculated using a cohort methodology in which freshmen are assigned to a cohort and expected to graduate four years later. The rate is calculated by dividing the number of students who graduate by year four by the sum of (1) the graduates and (2) the cohort members that dropped out any time during the four years.
[24] For the past several years, students have taken the Minnesota Comprehensive Assessment: Series II tests (MCA-IIs), which were aligned with the state standards adopted in 2003. During the 2010-2011 school year, however, students in grades 3 through 8 took the Series III (MCA-III) assessment in math. The new, more rigorous assessment is aligned with 2007 academic standards.
[25] Following direction from the U.S. Department of Education, MDE will limit the use of and then phase out the MCA-Modified assessment by the 2014-2015 school year.
[26] 2005-2006 was the only school year in which the state’s special education testing participation rate (86 percent) failed to meet the established target. This is likely due to the fact that the MCA-II was a new assessment at that time and the accommodation options and alternative assessments were not phased in until 2006-2007.
[27] Minnesota Department of Education, Minnesota Part B Annual Performance Report (Roseville, MN, 2012), 20.
[28] MDE defines “higher education” as full- or part-time enrollment in a community college (two-year program) or college/university (four-year program) for at least one term. “Other postsecondary education or training” includes enrollment full or part time in programs such as Job Corps, adult education, workforce development programs, or vocational/technical school with programs shorter than two years for at least one complete term. MDE defines “competitive employment” as working for pay at or above the minimum wage in a setting with others who are nondisabled for a period of 20 hours a week for at least 90 days (including military employment). “Some other employment” means working for pay or being self-employed for at least 90 days, including work in a family business such as a farm or a store, among other things.
[29] As mentioned earlier in this chapter, the number of infants, toddlers, and preschool students receiving special education has also increased. While some research shows that earlier identification and interventions can ultimately decrease special education costs, we did not examine this as part of our evaluation.
Chapter 3 - Funding and Cost Drivers
The state of Minnesota and local education agencies have made large investments in special education. Funding for special education consists largely of (1) revenue from federal and state sources that is specifically allocated to special education and (2) state general education revenue. Many school districts also supplement that funding with referendum-approved local revenues. In this chapter, we briefly explain how Minnesota funds special education. We describe revenue sources for special education and analyze how much local education agencies (LEAs) spend on special education, as well as their types of expenditures. Finally, we analyze trends in LEAs’ special education staffing and examine views of school district officials on what drives costs in special education.
Funding
For each student qualifying for special education, the state provides school districts with general education revenues, just as it does for students in general education. It also provides revenues specifically for special education. Minnesota’s special education revenues are calculated in two components: regular special education revenue and excess cost aid. The amount of the state’s regular special education revenue is capped in law each biennium, and the statutory cap was $787 million for fiscal year 2011.[1]
[Sidebar]
For each student receiving special education, the state provides a school district with general education revenues, as well as revenue specifically for special education costs.
[End of Sidebar]
The capped state aid is distributed to individual school districts via a reimbursement formula. The amount of a school district’s regular special education revenue is based on a prorated amount of that district’s yearly spending for certain items, such as 68 percent of special education teacher salaries. Exhibit 3.1 lists the items on which the state’s regular special education revenue is calculated. Regular special education revenue is adjusted by an enrollment ratio and then prorated so that statewide revenues for reimbursing district costs do not exceed the statutorily set cap.[2] Beginning with fiscal year 2012, an inflation factor (of 1.046) has been added to the formula, which will increase the statewide amount available for regular special education revenue.[3]
[Sidebar]
State funds partially reimburse school districts for items such as salaries of special education teachers.
[End of Sidebar]
The second component of state revenues for special education is “excess cost aid.” If a district’s special education costs exceed what is available through the regular special education revenue and are greater than 4.36 percent of its total general education revenue, the district is eligible for excess cost aid. Such aid, however, covers only up to 75 percent of a district’s unreimbursed costs for special education. In addition, like regular special education revenue, the state’s total excess cost aid is a capped amount set in statute.[4] Consequently, if school districts’ collective need for the excess cost aid exceeds the cap set in statutes, each district’s amount is prorated downwards to fit within the capped amount.
Exhibit 3.1: Components of School Districts’ Regular Special Education Revenue, 2012
|
|
|
· 68 percent of salaries for essential personnel (teachers, related services staff, and support-services staff providing direct services to students)a |
|
|
|
· 52 percent of the difference between the general education basic allowance and the resident district’s cost for special education services provided by its contracts with agencies other than school districts |
|
|
|
· 52 percent of the contract amount for supplementary special education provided via a resident district’s contracts with agencies other than school districts |
|
|
|
· 47 percent of supplies and equipment for educating students in special education; this amount is capped at an average $47 per student annually |
|
|
|
· 47 percent of certain travel by teachers in transition programs |
|
|
|
· Costs for certain transportation services for students with disabilities and for depreciation of certain busesb |
NOTES: Amounts of regular special education revenue are calculated based on the sum of these factors’ costs, which is multiplied by a statewide enrollment ratio from the current and previous year. Actual amounts of revenue to districts are prorated so that statewide revenues for reimbursing district costs do not exceed the statutory capped amount.
a For Minnesota’s State Academy for the Deaf and State Academy for the Blind, another factor is 68 percent of salaries for instructional aides for students who are blind or deaf; aides must have been assigned in individual education programs (IEPs) to work with students.
b Minnesota Statutes 2012, 123B.92, subd. 1(b)(4)(i)-(viii), specify the types of transportation services included. Depreciation is included only for district-owned buses purchased after July 1, 2005, and used for transporting students with disabilities.
SOURCES: Minnesota Statutes 2012, 125A.76, subds. 2 and 4; and Minnesota House of Representatives Research Department, Minnesota School Finance: A Guide for Legislators (St. Paul, October 2012), 55.
State funds may be used to reimburse LEAs for only certain items, such as the salaries of special education teachers. They may not be used for other items, such as benefits paid to special education staff, or ongoing services for at-risk students, such as suicide prevention services. Further, state funding must have a separate accounting system from federal special education revenues to the state (although separate bank accounts are not required).
[Sidebar]
When state and federal funds for special education are insufficient to reimburse costs, school districts must use additional general education revenues to cover costs.
[End of Sidebar]
The federal Individuals with Disabilities Education Act lays out requirements for special education across the country. The act authorized Congress to help fund special education by paying up to 40 percent of the national average per student expenditure, after adjustments for population changes. However, since the original law’s enactment decades ago, Congress has never appropriated special education funding near that level.
[Sidebar]
This use of additional general education revenue is called a “cross subsidy.”
[End of Sidebar]
When the combined federal and state revenues for special education are insufficient to cover costs, school districts must turn to other general education revenues—known as a “cross subsidy”—to pay for special education.[5] Other general education revenues consist of general education aid from the state; but paying for the cross subsidy may also include using dollars raised locally when voters approve school districts’ operating levy referenda, as discussed further below. Districts do not have authority to levy local property taxes specifically to fund special education. Authority to school districts for a special education local levy was phased out beginning in the mid-1990s and eliminated entirely by the 1999-2000 school year.
Revenues for Special Education
Revenues for Minnesota’s special education services have been significant and growing. We found that:
· In fiscal year 2011, revenues for special education in Minnesota exceeded $1.8 billion, a 3-percent increase over the prior year.
Revenues for special education have increased most years since 2000 after accounting for inflation. From fiscal year 2000 to 2011, revenues increased $503 million or 38 percent in inflation-adjusted 2011 dollars.
Most revenues for special education come from the state and some come from the federal government. We found that from fiscal years 2000 through 2011:
· The majority of revenues for special education came from the state for special education purposes (a median 56 percent); about one‑third represented a portion of the state’s general education revenues and local revenues that school districts used to pay for special education expenses (a “cross subsidy”); and about 11 percent came from the federal government.
The state’s median 56-percent share is a combination of (1) dedicated special education revenues and (2) a portion of general education revenue that follows students receiving special education (in the same way that general education revenue is allocated to districts for students without disabilities). The cross subsidy is made up of (1) a portion of the state’s general education revenues, which was intended for general education purposes but used instead to cover costs of special education; and, for certain districts, (2) a share of local revenues raised when school district voters approve operating levies.[6] The cross subsidy has represented about one-third of total revenues for special education since fiscal year 2000, with the exception of two years (2010 and 2011) when the federal share increased due to one-time American Recovery and Reinvestment Act stimulus money.
[Sidebar]
The share of federal revenues for special education has changed slightly over the years but has never been more than 16 percent of the total.
[End of Sidebar]
The share of revenues from the federal government changed slightly over the years but was never more than 15.8 percent of the total. It is estimated to have decreased in fiscal year 2012 to 9.8 percent. Exhibit 3.2 shows the trends. The Minnesota Department of Education (MDE) estimates the federal share of revenues will continue to decrease through 2015, resulting in an increase in the cross subsidy paid by school districts (unless the state were to increase special education revenues).
Exhibit 3.2: Revenues for Special Education by Source, Fiscal Years 2000-2012
![]() [NUMERIC REPRESENTATION OF GRAPHIC]
[NUMERIC REPRESENTATION OF GRAPHIC]
|
|
Fiscal Year |
||||||||||||
|
2000 |
2001 |
2002 |
2003 |
2004 |
2005 |
2006 |
2007 |
2008 |
2009 |
2010 |
2011 |
2012 |
|
|
State |
59.45% |
60.70% |
59.70% |
58.23% |
56.31% |
54.30% |
51.77% |
49.04% |
57.15% |
56.19% |
53.73% |
54.81% |
57.44% |
|
Federal |
6.33 |
7.04 |
7.94 |
9.12 |
10.42 |
11.54 |
11.93 |
11.24 |
10.72 |
10.39 |
15.80 |
15.30 |
9.85 |
|
Local Adjusted Net Cross Subsidya |
34.23 |
32.26 |
32.36 |
32.65 |
33.27 |
34.16 |
36.30 |
39.72 |
32.13 |
33.42 |
30.48 |
29.89 |
32.72 |
a Net cross subsidies refer to school districts’ use of a portion of state general education revenues, or of local operating levy referenda, to pay for special education expenditures.
b Data for 2012 are estimated.
SOURCE: Office of the Legislative Auditor, analysis of Minnesota Department of Education’s “State Total Special Education Cross-Subsidies, Year to Year Comparison,” fiscal years 2000-2012.
Cross Subsidies
As explained above, in Minnesota, state aid is combined with federal aid to reimburse school districts for special education costs. However, the total amount of aid to many school districts is less than the amount of their special education expenses. We found that:
· Since fiscal year 2000, school districts have had to divert a substantial portion of general education dollars and local operating levies to pay for special education expenditures.
[Sidebar]
School officials have voiced concerns about cross subsidies because the subsidies lower the amount of general education revenues available for all students.
[End of Sidebar]
School board members have expressed concern about the growing cross subsidies because the subsidies lower the amount of general education revenues available for all students. For instance, a school board member we interviewed said that the district’s operating levy had been intended to cover costs for lower class sizes and expanded busing. However, funding needed for the cross subsidy caused the district to divert part of its levy revenues from those purposes to special education purposes instead.
To report on cross subsidies, MDE uses three different calculations.[7] Each looks at the cross subsidy in a particular way and offers different advantages, which are summarized in Exhibit 3.3. All of the methods, however, are estimates. They cannot account for the varying needs (and thus, the varying costs) of each individual student receiving special education. Although the estimates lack this level of precision, they provide reasonable and consistent ways to describe the scope of the cross subsidy.
The first of MDE’s calculations is the “gross cross subsidy.” This shows the gap between the level of spending on special education and the amount of state and federal revenues dedicated to special education. It assumes that only revenues categorically dedicated to special education are available to pay special education costs. In fiscal year 2011, Minnesota’s statewide gross cross subsidy was $615.8 million.
The second calculation is the “adjusted net cross subsidy.” It, too, accounts for spending of both federal and state revenues, but it recognizes that a portion of general education revenue follows students receiving special education and is reasonably used to pay for special education costs. In MDE’s calculation, this portion is revenue for direct instructional costs attributable to certain students receiving special education—students who have special education outside the general classroom for at least 60 percent of their school day. For these students, MDE calculates a share of general education revenues used to pay for instructional purposes and adds it to the dedicated revenues for special education.[8] This adjusted amount of revenues reduces the gap between special education costs and revenues available to pay those costs. Compared with the gross cross subsidy, the calculation produces a lower but more accurate amount of cross subsidies statewide. For fiscal year 2011, Minnesota’s statewide adjusted net cross subsidy was $546.2 million.
Exhibit 3.3: Minnesota Department of Education’s Calculations of Cross Subsidies for Special Education
|
Method |
Description |
Sources of Funding Dataa |
Pros and Cons |
|
|
|
|
|
|
Gross Cross Subsidy |
Calculates the statewide difference between (1) revenues dedicated to special education and (2) expenditures for special education |
Federal and state revenues dedicated to special education |
Pro: Illustrates how expenditures on special education statewide exceed revenues dedicated to special education
Con: Ignores the availability of state general education revenues (attributable to students in special education) to help pay costs of special education |
|
|
|
|
|
|
Adjusted Net Cross Subsidy |
Adjusts revenue for special education statewide by adding revenues that pay for instructional costs; additional revenues are a portion of general education revenues that apply to certain students in special education (those spending at least 60 percent of their day outside the general classroom) for the estimated time they spend outside the general classroom |
Federal and state revenues dedicated to special education plus state general education revenues |
Pro: Provides a more accurate picture of the subsidy by showing how certain general education revenues attributable to students in special education help reduce the subsidy for special education
Con: Cannot be calculated by MDE on an individual district basisb |
|
|
|
|
|
|
School District Cross Subsidy |
Estimates an adjusted cross subsidy for individual school districts |
State revenue only, but from both general education and special education revenues |
Pro: Allows comparisons of district-by-district cross subsidies
Con: Cannot calculate how much federal revenue is available for special education in an individual district, leading to a less precise estimate of the subsidyb |
NOTES: Cross subsidies refer to how much revenue from sources other than those dedicated to special education are needed to pay for special education expenditures. The Minnesota Department of Education (MDE) uses the three calculations described here to show different characteristics of the cross subsidy.
a Describes the revenue data that MDE uses in calculating cross subsidies.
b MDE is unable to calculate federal revenues per individual district because some of these revenues flow to cooperative special education entities, which allocate them to their member districts. MDE does not track such allocations.
SOURCE: Office of the Legislative Auditor, analysis of Minnesota Department of Education’s “Special Education Cross-Subsidies FY2011 Report to the Legislature As required by Minnesota Statutes 2011 Section 127A.065” (St. Paul, January 2012).
We focused our analysis on MDE’s third calculation, which allows a comparison of cross subsidies on a district-by-district basis, something neither of the first two methods do. For this, however, MDE is limited to using only state revenues and expenditures for special education, not federal aids and expenditures.[9] As with the second method, this calculation presents an adjusted net cross subsidy—to account for the portion of general education revenue that follows students receiving special education—but it is based exclusively on state revenues. This results in a less precise estimate of the cross subsidy, but yields what MDE calls a “close approximation.” To distinguish it from the adjusted net cross subsidy described above, we refer to it as the “school district cross subsidy.” Our analysis showed:
· Between fiscal years 2000 and 2011, the school district cross subsidy increased 40 percent in 2011 dollars adjusted for inflation.
In fiscal year 2000, this school district cross subsidy amounted to $408.6 million for all school districts in 2011 dollars adjusted for inflation over time. It increased to $571.5 million by fiscal year 2011. Exhibit 3.4 shows how the school district cross subsidy across all districts changed over the 12-year period.
[Sidebar]
The sum of school district cross subsidies for special education (excluding federal funding) amounted to $571.5 million in fiscal year 2011.
[End of Sidebar]
In fiscal year 2011, 336 districts paid a school district cross subsidy.[10] We found that:
· Larger school districts, and those located either in the seven-county metropolitan area or regional centers around the state, tend to bear the largest school district cross subsidy burdens.[11]
Exhibit 3.4: Sum of School District Cross Subsidies, Fiscal Years 2000-2011
[NUMERIC REPRESENTATION OF GRAPHIC]
|
Fiscal Year |
Not Adjusted for Inflation |
In 2011 Dollars Adjusted for Inflation |
|
2000 |
$312,491,932.38 |
$408,557,883.95 |
|
2001 |
$310,603,043.06 |
$395,335,553.21 |
|
2002 |
$328,825,146.94 |
$412,486,589.93 |
|
2003 |
$355,642,416.82 |
$436,908,352.87 |
|
2004 |
$381,368,245.66 |
$454,907,480.44 |
|
2005 |
$417,234,965.52 |
$482,408,177.48 |
|
2006 |
$471,012,455.93 |
$522,909,464.71 |
|
2007 |
$548,397,076.47 |
$594,793,850.72 |
|
2008 |
$478,430,575.00 |
$491,389,465.39 |
|
2009 |
$567,892,020.97 |
$595,768,309.23 |
|
2010 |
$511,619,368.52 |
$530,184,582.31 |
|
2011 |
$571,509,207.04 |
$571,509,207.04 |
NOTES: The school district cross subsidy is the portion of state general education revenue and local operating referenda revenue needed to pay for special education expenditures after adjusting for a share of general education revenue that follows students in special education. It is calculated on only state aids to school districts for special education; federal aids are excluded. Data lines are the sums of school district cross subsidies across all districts in the state each year. The dashed line shows what each year’s cross subsidy would be if spent in fiscal year 2011; the solid line shows nominal amounts not adjusted for inflation.
SOURCE: Office of the Legislative Auditor, analysis of Minnesota Department of Education’s Cross-Subsidy Files by School District, fiscal years 2000-2011.
[Sidebar]
School districts in the metropolitan area and regional centers around the state tended to have larger school district cross subsidies per student than other districts.
[End of Sidebar]
These school districts tended to pay the most in overall subsidy and most often had relatively high subsidies per adjusted pupil unit.[12] St. Paul Public Schools paid the largest amount in fiscal year 2011, with a cross subsidy of $36.3 million. Minneapolis and Anoka-Hennepin districts paid $34 million and $30.9 million, respectively. Out of 336 school districts, 25 large districts, mostly in the seven-county metropolitan area, paid 55 percent of total school district cross subsidies in the state in fiscal year 2011, even though they accounted for just 46 percent of all adjusted pupil units.
Moreover, most of these 25 districts paid more in school district cross subsidy on a per-student basis than the state average of $631 per adjusted pupil unit. Exhibit 3.5 lists these districts and their school district cross subsidies.
Exhibit 3.5: Largest School District Cross Subsidies, Fiscal Year 2011
|
School District |
Cross Subsidy (in millions) |
Cross Subsidy per Studenta |
Outside Twin Cities Areab |
|
|
|
|
|
|
St. Paul Public Schools |
$ 36.3 |
$838 |
|
|
Minneapolis Public Schools |
34.0 |
906 |
|
|
Anoka-Hennepin School District |
30.9 |
697 |
|
|
Rosemount-Apple Valley-Eagan |
22.7 |
721 |
|
|
Osseo Area Schools |
21.7 |
904 |
|
|
Robbinsdale Area Schools |
12.2 |
868 |
|
|
South Washington County Schools |
12.2 |
613c |
|
|
Elk River Area School District |
10.8 |
743 |
ü |
|
Lakeville Area Public Schools |
9.8 |
756 |
|
|
North St. Paul-Maplewood-Oakdale School District |
9.6 |
744 |
|
|
Burnsville Eagan Savage School District |
9.5 |
844 |
|
|
Rochester Public Schools |
9.5 |
518c |
ü |
|
Mounds View Public Schools |
8.7 |
754 |
|
|
St. Cloud Area School District |
8.6 |
799 |
ü |
|
Bloomington Public Schools |
8.4 |
700 |
|
|
White Bear Lake Area Schools |
8.3 |
877 |
|
|
Wayzata Public Schools |
8.2 |
675 |
|
|
Duluth Public Schools |
8.1 |
802 |
ü |
|
Eden Prairie Schools |
8.0 |
715 |
|
|
Stillwater Area Public Schools |
6.7 |
663 |
|
|
Roseville Area Schools |
6.7 |
830 |
|
|
Hopkins Public Schools |
6.2 |
730 |
|
|
Centennial School District |
6.0 |
792 |
|
|
Shakopee Public Schools |
5.8 |
716 |
|
|
Edina Public Schools |
5.8 |
604c |
|
|
|
|
|
|
|
Statewide |
$571.2 |
$631 |
|
NOTES: Subsidies reported here are “school district cross subsidies,” which refer to the portion of state general education revenue and local operating referenda revenue needed to pay for special education expenditures after adjusting for a share of general education revenue that follows students in special education. Amounts reported here represent the portion of the subsidy calculated on only state aids to school districts for special education; federal aids are excluded.
a In the calculation, “student” was the “adjusted pupil unit,” which is a count of students attending public school that reflects the percentage of time students were enrolled and is weighted by grade level. It also accounts for students who attended school outside their resident district.
b The “Twin Cities Area” is the seven-county metropolitan region (consisting of Anoka, Carver, Dakota, Hennepin, Ramsey, Scott, and Washington counties).
c Indicates the per pupil cross subsidy was less than the state average of $631.
SOURCE: Office of the Legislative Auditor, analysis of Minnesota Department of Education’s Cross-Subsidy Files by School District, fiscal years 2000-2011.
Among the 82 school districts in the metropolitan area or regional centers in 2011, the school district cross subsidy per adjusted pupil unit was $696. Of these 82 districts, 55 percent had cross subsidies larger than the state average. At the same time, the remaining 255 districts (in relatively smaller communities outside the metropolitan area) paid an average of $453 in school district cross subsidy per adjusted pupil unit; only 12 percent had subsidies larger than the state average. Exhibit 3.6 shows the differences.
Exhibit 3.6: School District Cross Subsidies by Community Size and Location, Fiscal Year 2011
|
|
Number of Districts |
Cross
Subsidy |
Cross Subsidy per Studenta |
Districts Exceeding State Cross Subsidy per Studenta |
|
|
|
|
|
|
|
Statewide total |
337 |
$571.2 |
$631 |
— |
|
|
|
|
|
|
|
Districts in Twin Cities metropolitan area or a regional centerb |
82 |
462.1 |
696 |
55% |
|
|
|
|
|
|
|
Rural districts in communities with populations of less than 10,000 |
255 |
109.1 |
453 |
12% |
NOTES: Cross subsidies reported here are “school district cross subsidies,” meaning the portion of state general education revenue and local operating referenda needed to pay for special education expenditures after adjusting for a share of general education revenue that follows students in special education. Amounts reported here represent the portion of the subsidy calculated on only state aids to school districts for special education; federal aids are excluded.
a In the calculation, “student” was the “adjusted pupil unit,” which is a count of students attending public school that reflects the percentage of time students were enrolled and is weighted by grade level. It also accounts for students who attended school outside their resident district.
b We defined “regional center” as a community with a population of 10,000 or more and located outside the seven-county metropolitan area.
SOURCE: Office of the Legislative Auditor, analysis of Minnesota Department of Education’s Cross-Subsidy Files by School District, fiscal years 2000-2011.
[Sidebar]
Certain school officials said the need to use general education revenue to pay for special education costs has forced them to forego other spending that affects the entire student population.
[End of Sidebar]
During our evaluation, we interviewed superintendents, school business officials, and other school district officials. From them we learned that:
· Due to substantial school district cross subsidies, certain school districts are forced to use their unrestricted, general education dollars to pay for special education expenses.
Because special education is an entitlement, school districts must pay special education costs. Minnesota’s statutory caps on the regular special education revenue, as well as on the excess cost revenue, result in insufficient dedicated state aid to reimburse districts for rising special education costs. Local school officials told us that the need to use general education revenue to pay for special education costs has forced them to forego other items, such as lower general education class sizes, that affect their entire student population. Most school districts in Minnesota have voter-approved operating levies in place. School districts use those revenues for a variety of purposes, which may or may not include special education. Although we did not see a pattern between the size of operating levies and the size of cross subsidies, in some districts the scope of the cross subsidy was similar in size to the district’s operating levy. In St. Paul Public Schools, for instance, the cross subsidy was $838 per adjusted pupil unit in fiscal year 2011, while the operating levy was $647 per pupil. Lakeville Area Public Schools had a cross subsidy estimated at $756 per adjusted pupil unit and an operating levy of nearly $880 per pupil.
Expenditures
Minnesota’s LEAs reported spending nearly $1.1 billion in state regular special education revenue and excess cost revenue for special education in fiscal year 2011.[13] The $1.1 billion represented a substantial increase over fiscal year 2000 when expenditures from state sources totaled $880.6 million in inflation-adjusted 2011 dollars. We found that:
· Between fiscal years 2000 and 2011, local education agency expenditures of state resources for special education increased 22 percent in inflation-adjusted 2011 dollars.
In most years of this 12-year period, inflation-adjusted expenditures increased; in the remaining two years (fiscal years 2008 and 2011), the year-to-year decreases were less than 1 percent. The median annual increase during the period was 1.6 percent using inflation-adjusted 2011 dollars. The rise in overall spending reflects the concurrent 11-percent increase in the number of students receiving special education described in Chapter 2. It also reflects the costs associated with students who remain in special education over their school years; Chapter 2 showed that, on average, only 17 percent of students receiving special education moved to a less restrictive setting or had their individualized educational programs (IEPs) terminated during a given school year between fiscal years 2000 and 2010.
[Sidebar]
The number of students receiving special education increased
11 percent between fiscal years 2000 and 2011, while inflation-adjusted expenditures of state resources dedicated to special education rose 22 percent during that period.
[End of Sidebar]
LEAs also use money from federal sources for special education purposes. Exhibit 3.7 shows expenditures and changes over time of state and federal sources using inflation-adjusted dollars.[14]
Exhibit 3.7: Expenditures of Special Education Revenues by Funding Source (Adjusted for Inflation), Fiscal Years 2000-2011
|
|
Statea |
Federalb |
Totalc |
|||||
|
Fiscal Year |
Expenditures (in millions) |
Annual Change |
Percentage of Totala, b |
Expenditures (in millions) |
Annual Change |
Percentage of Totala, b |
Expenditures (in millions) |
Annual Change |
|
|
|
|
|
|
|
|
|
|
|
2000 |
$ 880.6 |
— |
90.7% |
$ 90.4 |
— |
9.3% |
$ 971.1 |
— |
|
2001 |
904.8 |
2.7% |
90.1 |
99.4 |
9.9% |
9.9 |
1,004.2 |
3.4% |
|
2002 |
933.2 |
3.1 |
89.1 |
114.5 |
15.2 |
10.9 |
1,047.7 |
4.3 |
|
2003 |
953.7 |
2.2 |
87.4 |
137.4 |
20.0 |
12.6 |
1,091.1 |
4.1 |
|
2004 |
957.7 |
0.4 |
85.7 |
159.3 |
15.9 |
14.3 |
1,117.0 |
2.4 |
|
2005 |
964.6 |
0.7 |
83.8 |
186.2 |
16.9 |
16.2 |
1,150.8 |
3.0 |
|
2006 |
969.5 |
0.5 |
83.3 |
194.6 |
4.5 |
16.7 |
1,164.1 |
1.2 |
|
2007 |
1,000.8 |
3.2 |
84.3 |
186.1 |
-4.4 |
15.7 |
1,186.9 |
2.0 |
|
2008 |
991.3 |
-1.0 |
85.0 |
175.4 |
-5.8 |
15.0 |
1,166.6 |
-1.7 |
|
2009 |
1,066.0 |
7.5 |
84.9 |
189.7 |
8.2 |
15.1 |
1,255.7 |
7.6 |
|
2010 |
1,082.6 |
1.6 |
— |
— |
— |
— |
— |
— |
|
2011 |
1,077.6 |
-0.5 |
— |
— |
— |
— |
— |
— |
NOTE: Data are adjusted for inflation and expenditures are reported in 2011 dollars.
a State funding sources include special education revenues (to all districts) and excess cost revenues (to districts whose special education spending exceeded 4.36 percent of their general education revenue). They also include dollars for extended year programs (summer school), alternative delivery programs, state-paid tuition for non-Minnesota students placed by court action in care-and-treatment facilities, tuition for resident students placed in care-and-treatment facilities outside Minnesota, state payments for students temporarily placed in a state institution, third-party revenues, and payments for local collaborative time-study projects. However, state sources do not include general education aid that follows students in special education, except for a few uncommon instances (such as when districts contract with a nonpublic school agency to meet a student’s special education needs.)
b Data on expenditures from federal sources were not available for fiscal years 2010 or 2011.
c Totals are not presented for fiscal years 2010 or 2011 because federal data were not available.
SOURCE: Office of the Legislative Auditor, analysis of Minnesota Department of Education’s Electronic Data Reporting System data, fiscal years 2000-2011.
For the years when full data were available, expenditures from state sources far exceeded those from federal sources. For example, in fiscal year 2009, expenditures from state resources represented 85 percent of total expenditures, while federal resources accounted for just 15 percent. In the years between 2000 and 2009, expenditures from state resources were never lower than 83 percent of the total.
Because federal data were not available for fiscal years 2010 and 2011, we compared expenditures of federal resources for the ten-year period between fiscal years 2000 and 2009. For the most recent year when data were available (fiscal year 2009), LEAs spent $189.7 million (adjusted for inflation to 2011 dollars) of federal special education funds. We found that:
· Between fiscal years 2000 and 2009, local expenditures of federal resources for special education increased more than 110 percent in inflation-adjusted 2011 dollars.
During this ten-year period, year-to-year changes in special education spending of federal resources ranged from a 6-percent decrease to a 20-percent increase. The median annual increase was nearly 10 percent. Yet, as described earlier, federal resources have never represented more than 16 percent of the total in the years since 2000.
Spending by Type of Expenditure
Local education agencies spend special education dollars on a variety of items, but the largest type of expenditure by far is staff salaries.[15] According to MDE data:
· In fiscal year 2009, payroll for staff salaries amounted to $1.08 billion in inflation-adjusted 2011 dollars, representing 86 percent of special education expenditures.
Across the ten fiscal years from 2000 through 2009, payroll expenditure was consistently the largest segment of spending, always at least 86 percent of total expenditures.[16] Payroll expenditures include only the time that staff are working in special education, and they do not include fringe benefits.[17]
Expenditures other than payroll are far smaller shares of total spending. For instance, fringe benefits are the third largest type of spending, but they represented just 3 percent of total special education expenditures in fiscal year 2009. Exhibit 3.8 shows the top ten types of spending in special education and the shares they represented of total spending in fiscal year 2009.
Spending by Disability Category
Students receiving special education have different disabilities and varying needs, which can lead to differences in costs. To understand how spending varies by disability categories, we analyzed expenditures by each category.
Exhibit 3.8: Spending on Top Ten Types of Special Education Expenditures, Fiscal Year 2009
|
Type of Expenditure |
Expenditures
|
Percentage of Total Spending |
|
|
|
|
|
Payroll for personnel (salaries only)a |
$1,079.7 |
86.0% |
|
Purchase of personnel services from another district, cooperative, or intermediate district |
44.4 |
3.5 |
|
Fringe benefits |
38.2 |
3.0 |
|
Contracted agency services delivered to students in district facilities |
32.6 |
2.6 |
|
Contracted placement of students with private and public agencies other than school districts |
14.3 |
1.1 |
|
Individualized instructional supplies or materials |
12.2 |
1.0 |
|
Professional development opportunities |
7.4 |
0.6 |
|
Staff travel to serve students in special education |
4.6 |
0.4 |
|
Equipment for instruction or adaptive technology |
3.2 |
0.3 |
|
Indirect costsb |
3.0 |
0.2 |
NOTES: Data are adjusted for inflation and reported in 2011 dollars. All remaining types of expenditures not listed here represented about 1 percent of total special education expenditures combined. Data include both state and federal sources but are from fiscal year 2009 because federal data are not available for fiscal years 2010 and 2011. State sources include special education revenues and excess cost revenues but exclude most general education aid that follows students in special education.
a Includes all personnel for the time they serve students in special education but excludes fringe benefits.
b Indirect costs are administrative costs of handling federal funds, such as districts’ general administrative and accounting functions.
SOURCE: Office of the Legislative Auditor, analysis of Minnesota Department of Education’s Electronic Data Reporting System data, fiscal year 2009.
Within a single category of disability, students’ needs can vary considerably. In our analysis, we examined average costs per student. Data on costs included federal sources for special education and state sources dedicated to special education but not the state’s general education aid that follows students receiving special education. We found that:
· Average cost per student in fiscal year 2009 was 18 times higher in the category of developmental cognitive disabilities (severe-profound) than in the lowest cost category of traumatic brain injuries.[18]
For fiscal year 2009, the average cost per student with developmental cognitive disabilities (severe-profound) was about $47,250; average cost per student with traumatic brain injuries was about $2,580. (Costs have been adjusted for inflation and reported in 2011 dollars.) Other high cost-per-student categories in fiscal year 2009 were physical impairments and visual impairments, although neither category had a particularly high incidence of students, as Chapter 2 explained. Disability categories exhibiting the higher costs per student were the same in 2009 as the median for years back through 2000. The category of autism spectrum disorders had one of the strongest growth rates in number of students from 2000 through 2011 (more than 500 percent); expenditures were $10,120 per student in this category for fiscal year 2009, slightly above the statewide average across all disability categories.
[Sidebar]
The five disability categories with the highest average costs per student in fiscal year 2000 were also among the five highest in 2009.
[End of Sidebar]
At the other end of the cost spectrum, low cost-per-student categories in 2009 included those for students with traumatic brain injury and students with other health disabilities; the latter had the fourth highest incidence of students that year. Exhibit 3.9 shows expenditures by number of students in each category of disability for fiscal year 2009. Trends over time showed a similar pattern; the five disability categories exhibiting lower costs per student in 2009 were among the same disability categories with median low costs per student from 2000 through 2009.
Exhibit 3.9: Special Education Expenditures by Primary Disability Category, Fiscal Year 2009
|
|
Expendituresa (in millions) |
Number of Students |
Expenditure per Student |
|
|
|
|
|
|
Developmental cognitive disabilities: severe-profoundb |
$103.3 |
2,186 |
$47,252 |
|
Physically impaired |
46.7 |
1,708 |
27,320 |
|
Visually impaired |
11.0 |
438 |
25,020 |
|
Developmental cognitive disabilities: mild-moderateb |
120.7 |
6,745 |
17,887 |
|
Deaf and hard of hearing |
38.2 |
2,359 |
16,210 |
|
Emotional or behavioral disorders |
252.8 |
16,511 |
15,312 |
|
Developmental delay |
143.1 |
13,282 |
10,771 |
|
Autism spectrum disorders |
128.6 |
12,707 |
10,120 |
|
Deaf-blind |
0.7 |
77 |
9,001 |
|
Severely multiply impaired |
8.3 |
973 |
8,569 |
|
Specific learning disabilities |
229.7 |
30,536 |
7,524 |
|
Speech or language impairments |
109.5 |
21,479 |
5,098 |
|
Other health disabilities |
48.3 |
15,090 |
3,200 |
|
Traumatic brain injury |
1.2 |
469 |
2,583 |
NOTES: Calculations in this exhibit include public school students from birth to age 21, as well as nonpublic students of those ages who attended a public school part time. Data reflect students receiving special education services as of December 1 of the 2008-2009 school year. They do not include students who exited special education prior to December 1 or those who began receiving special education service later in the school year.
a Expenditure data are adjusted for inflation and reported in 2011 dollars. Expenditures include those funded by (1) federal revenue for special education and (2) state revenue dedicated to special education (including special education revenues and excess cost revenues but not general education aid that follows students in special education, except for a few uncommon instances).
b Developmental cognitive disabilities is a single disability category under Minnesota Rules 2007, 3525.1333; however, the rule recognizes two different ranges of the disability, and districts separate students by the severity of their disability for state reporting purposes.
SOURCES: Office of the Legislative Auditor, analysis of Minnesota Department of Education’s Electronic Data Reporting System data, fiscal year 2009; and Minnesota Department of Education’s Unduplicated Child Count data, 2008-2009.
[Sidebar]
The state’s formula for reimbursing school districts for special education expenses does not vary funding by disability category.
[End of Sidebar]
Cost per student by disability category can be significant for certain school districts, such as those with large shares of students in the higher-cost categories. School districts do not control which students live within their jurisdictions, but they are obligated to provide students receiving special education with the services they need. As described earlier, special education is funded through reimbursements of LEAs’ expenditures from primarily state sources; the formula for reimbursement varies by type of expenditure (for instance, the state reimburses 68 percent of teachers’ salaries). The formula is not, though, structured to vary by students’ disability categories.
Moreover, the district where a student resides bears the responsibility for paying special education costs when its students receiving special education attend charter schools or choose to enroll in a different school district. To the extent such students are in higher-cost disability categories, their resident districts face especially high costs but have little control over the students’ education. Certain issues related to responsibilities of resident districts are explored later in this chapter.
Costs Unique to Special Education
MDE has calculated what LEAs have spent over and above what they would have spent if none of their special education students had required special education. Because students receiving special education generate general education revenues (in addition to special education revenues), and often spend at least part of their school days in the general education classroom, MDE estimated extra costs by focusing on costs beyond those that students would have generated as general education students.
MDE collected data from a sample of school districts to estimate the proportion of students’ school days spent in a general classroom and in a special education classroom. It estimated the amount of general education spending in a district for students receiving special education and the amount of special education spending for them; separate estimates were made for elementary schools and secondary schools. The department then compared the spending per general education student with the spending per student receiving special education. The difference is the extra costs. MDE calculated these extra costs only for 2007. Its data showed for school districts and charter schools:
· When compared with spending for general education students, spending for special education in 2007 amounted to about $11,100 more per elementary student and about $8,070 more per secondary student in the median school districts.
Not every school district or charter school was estimated to have extra spending, but for those that did, spending per student receiving special education was thousands of dollars higher than spending per student in general education in 2007. Among such districts, the median elementary district or charter school spent $18,729 per special education student. By contrast, the median elementary district or charter school spent $7,629 per general education student. For these school districts and charter schools, Exhibit 3.10 shows the estimated per student spending for students in general and special education. It also shows the extra costs per student receiving special education at both elementary and secondary levels.
Exhibit 3.10: Estimated Spending and Extra Costs per Student Receiving Special Education for School Districts and Charter Schools, Fiscal Year 2007
|
|
Spending per General Education Student |
Spending per Student Receiving Special Education |
Extra Cost per Student Receiving Special Education |
|
|
|
|
|
|
Elementary Grades in a District |
|
|
|
|
Minimum |
$ 5,085 |
$ 9,686 |
$ 1,398 |
|
Median |
7,629 |
18,729 |
11,100 |
|
Maximum |
20,799 |
40,288a |
29,914 |
|
|
|
|
|
|
Secondary Grades in a District |
|
|
|
|
Minimum |
$ 5,511 |
$ 6,035 |
$ 1,296 |
|
Median |
8,398 |
16,470 |
8,072 |
|
Maximum |
20,317 |
34,782 |
25,058 |
NOTES: Extra cost is the difference between estimated per student spending in general education and estimated per student spending for students receiving special education. Spending per student receiving special education varies based on how much of a student’s day is in general classrooms and how much is in special education classrooms. Data are based on 192 school districts and charter schools with estimated excess costs. Each cell above represents a different school district or charter school that denotes the minimum, medium, or maximum in its category. The calculations defined “student” as “average daily membership,” which is a count of students attending public school that reflects the percentage of time students were enrolled and is weighted by grade level.
a The maximum per student spending was quite high because it was for a small district with just 31 total students at the elementary level. The next highest was a district with $34,348 per student spending.
SOURCE: Office of the Legislative Auditor, analysis of Minnesota Department of Education’s “‘FedEx Report’ by Local Education Agency,” fiscal year 2007.
RECOMMENDATION
The Legislature should consider options to reduce certain school districts’ substantial reliance on general education funding to pay for special education expenses.
Many options to address cross subsidies are available, but most involve the need to shift revenues from one source to another or raise additional revenues to ease the burden of school districts facing large cross subsidies. Selecting a particular option is a policy decision for the Legislature. While we do not recommend a preferred option, we present some possibilities and summarize their implications.
[Sidebar]
The Legislature and Minnesota Department of Education should consider ways to help school districts rein in rising costs for special education.
[End of Sidebar]
Identify Cost Controls. We believe that whatever option is selected, the Legislature and MDE should also consider ways that school districts can rein in rising costs. This is not a simple step due to (1) legal requirements that districts pay for all special education costs and (2) the federal regulation that districts maintain special education spending levels from one year to the next (known as “maintenance of effort,” which is explained more fully later in this chapter). Despite these constraints, some districts have begun to identify possible ways to control certain costs. For instance, we learned of one school district that is reassessing its use of technology and staff to determine whether it can continue to meet students’ needs by increasing its use of assistive technology. Its hope is to improve the education of certain students by using assistive technology in lieu of routinely assigning a paraprofessional to a student. We believe MDE should identify methods to help control spending and assist districts in adopting methods that provide appropriate levels of service while containing costs. This could involve working with districts to identify methods used to control costs and then training others on effective methods. One place to start would be providing school districts with comparative data showing how district practices, such as staffing patterns and the prevalence of having one paraprofessional work with a single student, compare with similar districts.
Work to Influence Congress. The federal government is one source of special education funding, but as data earlier in this chapter showed, it has been a limited source. Some school district officials we interviewed suggested that if the federal government ever appropriated the level of funding authorized in the Individuals with Disabilities Education Act, it would substantially reduce or eliminate school districts’ cross subsidies. Minnesota legislators may decide it is important to address the issue of federal funding with the state’s congressional representatives. However, the state has little control over what is done at the federal level.
Modify Authority for Local District Funding of Special Education. Minnesota’s current structure for local school districts’ special education funding presents additional options to consider. For instance, school districts could be authorized to levy locally for special education revenues. Some school officials have suggested allowing school boards to issue a discretionary levy for this purpose, which would be levied without a referendum. Such proposals are politically controversial and would not address the difficulty of raising sufficient local revenues for special education in areas of the state with low or exempt property wealth or concentrations of high-need students. A variant of this would retain voter-approved levies but increase the state’s financial assistance, or “equalization,” to revenues raised through local referenda. A similar proposal is part of the recommendations of a 2012 MDE working group on school finance. Although the state would share an increased part of the school district’s burden of raising local revenues, it still would be incumbent on local voters to approve referenda. The proposal diminishes but does not eliminate the difficulty of raising property taxes in some areas with large special education needs.
[Sidebar]
Most options for lowering the cross subsidy involve shifting existing revenues or raising new ones.
[End of Sidebar]
Modify the State Funding Formulas for Special Education. Changes to the state’s funding formula for special education offer another set of options. Each would, however, increase state costs. For instance, a 2012 MDE working group on school finance has proposed weighting the formula for special education revenue in ways that reflect the higher costs associated with certain disability categories. Doing so would provide increased revenues for districts with relatively larger proportions of higher-cost students in special education.[19] Another example is removing the statutory cap on either regular special education revenue or excess cost revenue. The former would help LEAs by providing additional regular special education revenues; the latter would target help to those districts with the highest special education needs. Another option is limiting the size of districts’ unreimbursed special education costs to a certain amount per student. This would be most helpful to districts with high levels of unreimbursed costs relative to the amount of their unfunded special education costs.
Other possible changes to the formulas have been suggested in the past. Making an informed decision would require analyses of each option’s costs to the state as well as its effect on reducing the cross subsidy.
Cost Drivers and Incentives
Funding shortfalls for special education result from a combination of limited revenues and rising costs. General inflation increases costs, but we found that:
· Many factors can contribute to rising costs for special education, and the structure for funding special education contains disincentives to control spending.
Staff salaries are the largest component of spending in special education, as described earlier. In the next section, we present data on staffing levels in local education agencies around the state. Following that, we describe what we learned from speaking with special education directors, school district business officials, and others who identified items they believe drive costs in special education. Finally, we describe the effects of certain legal requirements that people we interviewed believe work against efforts to control spending on special education.
Staffing
Staffing levels contribute to special education costs. Statewide in fiscal year 2011, LEAs had more than 28,600 full-time-equivalent (FTE) special education staff, based on data they reported to MDE. This was a substantial increase since 2000 when LEAs had 22,960 FTEs.[20] We found that:
· Full-time-equivalent special education staff in Minnesota increased about 25 percent between fiscal years 2000 and 2011.
Increases in FTE staff help explain the steady rise in expenditures reported earlier in this chapter. Numbers of special education FTE staff statewide generally increased each year during this period, although incomplete data in fiscal years 2010 and 2011 prevented calculating precisely to what extent that trend continued in the most recent years. Exhibit 3.11 shows the change over time.
Exhibit 3.11: Full-Time-Equivalent Staff in Special Education, Fiscal Years 2000-2011
|
Fiscal Year |
Full-Time-Equivalent Staff |
Annual Change |
|
|
|
|
|
2000 |
22,960 |
— |
|
2001 |
23,679 |
3.1% |
|
2002 |
24,278 |
2.5 |
|
2003 |
25,008 |
3.0 |
|
2004 |
25,641 |
2.5 |
|
2005 |
26,551 |
3.5 |
|
2006 |
26,934 |
1.4 |
|
2007 |
27,576 |
2.4 |
|
2008 |
27,797 |
0.8 |
|
2009 |
28,358 |
2.0 |
|
2010a |
26,654 |
— |
|
2011a |
28,632 |
— |
|
Total 2000-2011a |
314,067 |
|
|
Increase 2000-2011a |
|
24.7% |
NOTE: The Minnesota Department of Education calculates full-time-equivalent staff based on data reported by local education agencies.
a Calculations for fiscal years 2010 and 2011 are incomplete because certain data for those years were unavailable. Consequently, the total number of full-time-equivalent staff between 2000-2011, and the overall increase, likely understate the actual growth.
SOURCE: Office of the Legislative Auditor, analysis of Minnesota Department of Education’s Electronic Data Reporting System data, fiscal years 2000-2011.
[Sidebar]
Paraprofessionals and teachers accounted for the two largest groups of special education staff; the groups grew 36 percent and
5 percent, respectively, from 2000 to 2011.
[End of Sidebar]
Numerous different types of personnel work in special education. Besides classroom teachers, LEAs around the state employ paraprofessionals; paraprofessionals supplement instructional activities and work under the direction of a teacher or related-services staff. Other special education staff include specialists (such as for adaptive physical education or assistive technology), speech/language pathologists, occupational therapists, school social workers, and psychologists, among many others.
While many different types of professionals work in special education, the largest groups are teachers and paraprofessional staff. In fiscal year 2011, paraprofessionals made up 46 percent of all FTE staff in special education, and teachers accounted for 32 percent. Educational speech/language pathologists, who are licensed to work with children diagnosed with speech or language impairments, comprise the next largest group but represented just 6 percent of all special education FTE staff in 2011. Exhibit 3.12 shows the breakdown of the largest groups.
Exhibit 3.12: Full-Time-Equivalent Special Education Staff by Personnel Type, Fiscal Year 2011
[NUMERIC REPRESENTATION OF GRAPHIC]
Paraprofessionals 46%
Teachers 32%
Other Types 6%
Speech/Language Pathologists 6%
School Social Workers 3%
Psychologists 2%
Occupational Therapists 2%
Program Coordinators 2%
Adaptive Physical Education Specialists 1%
NOTE: The term “Other Types” includes about 30 other professions, such as directors of special education, behavior specialists, and mental health professionals, none of which accounted for more than 0.8 percent on its own.
SOURCE: Office of the Legislative Auditor, analysis of Minnesota Department of Education’s Electronic Data Reporting System data, fiscal year 2011.
Over time and across the state, the number of FTE staff grew for many, but not all, of the types of professions in special education. Among those professions for which LEAs reported data in both 2000 and 2011, the greatest growth rates (in excess of 200 percent) in FTE staff were for foreign language interpreters, program coordinators or due process facilitators, speech/language pathologists, and assistive technology specialists. However, each of these fast growing groups represented relatively small shares of overall FTE staff in special education (0.1 percent, 1.8 percent, 6 percent, and 0.06 percent, respectively, in 2011). Among special education professions with the sharpest declines in FTEs between fiscal years 2000 and 2011 were audiologists (-34 percent) and certified orientation and mobility assistants (-67 percent).
Teachers and paraprofessionals, representing the largest shares of FTEs in special education, showed growth in FTEs over time, with the most significant growth among paraprofessionals. The number of FTE teachers increased about 5 percent over 11 years, from approximately 8,850 in 2000 to 9,250 FTEs in 2011. Meanwhile, the number of FTE paraprofessionals grew 36 percent during this period, from about 9,700 FTEs in 2000 to nearly 13,200 in 2011.
Costs for staff salaries were one of the items most frequently mentioned by those we interviewed about what drives costs, as described more below. Tied to that is the impact of state licensure requirements for teachers. Minnesota requires teachers in special education to obtain specific licenses for certain disabilities such as emotional behavior disorders and specific learning disabilities. District representatives we interviewed said licensure affects district costs because teachers need training to obtain the credentials; the training itself has costs, and it may necessitate hiring class substitutes. Additional licensure can equate to higher salaries in some labor contracts. We also heard that the difficulties of licensure requirements can be especially keen in communities near the state border because neighboring states do not have such requirements. For instance, school officials told us that these states attract teaching candidates who do not want the burden of the additional training, putting Minnesota at a disadvantage when seeking sufficient numbers of qualified personnel.
Factors Contributing to Special Education Costs
As part of our evaluation, we spoke with school business officers in each of eight LEAs we visited, and we interviewed teachers and special education directors there; we also interviewed other school district representatives. (Appendix A provides background information on the eight case studies.) When asked to identify items that drive costs in their districts, people we interviewed most frequently described the increasing number of students with very high needs receiving special education. Some specifically mentioned rising numbers of students diagnosed with certain disabilities, such as autism spectrum disorders, for which districts may face added costs. Data in Chapter 2 (on increases in special education enrollment and in students enrolled by primary disability category) support these comments.
[Sidebar]
School officials we interviewed most frequently cited the increasing numbers of students with very high needs as a factor that drives costs in special education.
[End of Sidebar]
Some district officials identified ancillary costs associated with certain high-need students. For instance, they said some students with pronounced behavior disorders are prone to biting, kicking, and other physical aggression. Consequently, districts educating such students have faced costs for safety and precautionary measures, such as purchasing Kevlar sleeves and gloves to protect teachers from injuries. Another precautionary measure districts described is training teachers to work with students to defuse situations that may otherwise lead to physical altercations. Some also said injuries and the risk of attacks have affected workers’ compensation claims and costs for their LEAs.
LEA officials said another example of costs related to high-need students is remodeling or modifying space in school buildings to accommodate student needs. For instance, one business officer said the district had spent tens of thousands of dollars to build quiet rooms for students who need individual spaces when their behaviors escalate and they cannot interact with peers or adults. The district had also built individual classrooms for students whose needs require one-on-one instruction. Although extensive remodeling may not be commonly needed, district representatives indicated it can be expensive.
Many of the district business officers we interviewed during our site visits said payroll is the chief cost driver in special education. This is in line with data presented earlier in this chapter showing the high proportion of expenditures represented by staff salaries. Some officials in large, rural LEAs added that staff transportation costs are a significant cost because many of their special education teachers travel long distances throughout the year to work with students in multiple districts.
[Sidebar]
School officials also said certain services formerly provided by counties have diminished, leaving school districts as the payer of “last resort.”
[End of Sidebar]
Tied to both the prevalence of high-need students and payroll costs, several district business officials said a significant cost driver is staffing patterns with low adult-to-student ratios. They described increasing cases of districts assigning one paraprofessional (or one teacher) to a single student, and in some cases, two adults to one student. More staff create more costs.
Several of those we interviewed said another cost driver is the transfer of responsibilities for certain services from counties to LEAs. As they describe it, over time, some services previously provided by counties to students receiving special education have diminished or disappeared. Counties can choose the extent to which they provide mental health or transitional services to students with disabilities. School districts, however, have no choice but to provide services students need to improve their educational attainment. As some educators told us, the schools have become the payer of “last resort.” Some said counties have reduced county expenditures for services related to students receiving special education, such as independent living programs for students transitioning from high school to adulthood, knowing that school districts are required to provide such services until the student reaches age 21. Another example district representatives cited was the shifting of costs for health-related services intended for students receiving special education. They believe such shifts have led to increased district costs for services such as occupational therapy, physical therapy, speech therapy, and mental health services.
District officials we interviewed recognized that the costs they described are driven by students’ needs, as reflected in the students’ IEPs. Some officials said the IEP teams decide what services are needed to help a student, but teams make those decisions in a vacuum. Further, they said teams are not structured to weigh the value of a service against its costs. The teams’ function, according to federal rule, is to consider the students’ strengths along with their academic, developmental, and functional needs. IEP teams are legally required to consider whether a student requires assistive technology and services, but the requirement does not extend to consider costs of these services. Some district officials said IEP teams are neither necessarily aware of the costs of a service nor responsible for considering how their decisions fit into the context of the LEA’s funding capacity. But the officials believed that lack of financial considerations contributes to special education costs.
In addition, several officials said decisions on services are sometimes made to avoid the prospect of a legal challenge. Although they could not quantify how often this happened, they explained that it was less costly and time consuming to provide a service requested by a parent than to deny it and subsequently face the legal expenses, time, and stress of a due process hearing.
[Sidebar]
Some school district staff reported that it could be less costly and time-consuming to provide requested special education services than to contest such requests through a legal hearing.
[End of Sidebar]
For the most part, district officials stated that although many factors drive costs in special education, districts themselves have little opportunity to control these factors. In their view, they have to abide by what has been identified in IEPs if they are to provide a free and appropriate public education, as legally required.
Legal Requirements
In addition to identifying factors that drive costs, school district officials we interviewed described how certain legal requirements tended to deter LEAs’ efforts to achieve cost efficiencies. The two requirements most often mentioned were the (1) responsibility to pay for special education when students receive services outside their resident districts and (2) maintenance of effort.
Resident District Responsibilities
In Minnesota, students may reside in one school district but enroll in another district and receive special education there. Minnesota’s open-enrollment law allows students to apply to attend school outside their resident district boundaries.[21] In Minnesota:
· School districts are required to pay most costs of special education for their resident students, but they have little control over spending when resident students receive services outside the district.
In fiscal year 2011, almost 19,000 students, or 17 percent of all K-12 students receiving special education, attended school outside their resident districts. When students receiving special education enroll in a district other than the district in which they live, the law requires enrolling districts to plan and provide special education services, while resident districts must pay for the services.[22] The resident district may have a representative serve on the student’s IEP team but does not control team decisions on levels of service, according to school district representatives we interviewed. As a result, control over spending is largely removed from the resident school district.
Many of the special education directors and business officials in our focus groups and interviews viewed this as a disincentive for enrolling districts to control costs. They indicated that, as resident districts, they have to pay for special education expenses even though resident districts have little influence over the level of special education service provided to the child. One district official said the resident district feels “helpless” because it must pay for special education costs of students who enroll elsewhere, but it is not sufficiently involved in service decisions for these students. This causes difficulties for district budgeting. Others described cases where students came to them having been identified for special education and receiving an IEP in a different district. When these students came to their new district with IEPs already developed, the resident district simply had to pay the costs of honoring all previously identified services to meet students’ needs.
[Sidebar]
When school districts enroll students who are receiving special education, they must honor all services previously identified in the students’ IEPs.
[End of Sidebar]
Some district officials said parents use open enrollment to get services they are denied in their resident district. One parent told us that he enrolled his child in a charter school because it provided one-to-one paraprofessional support denied by the resident district.
Educators told us that transportation can be a major expense for resident districts when students with special transportation needs use open enrollment. They noted districts spend large sums of money on special transportation for open-enrolled students. Educators said if a need for specialized transportation is written into a student’s IEP, the serving district must transport that student across districts and bill the resident district. One educator gave an example of a student who lived 22 miles away from the school in which he enrolled and required a medical van for daily transport, which became a significant expense billed back to the resident district. Educators pointed out that state law does not require the resident district to pay for out-of-district transportation when students do not have special transportation services specified in their IEPs.
RECOMMENDATION
The Legislature should consider modifying laws that require school districts to pay special education costs of students who choose to enroll outside their resident districts.
Changing laws in this way would not impose costs on students or their families, but they would affect responsibility for payments among school districts. At one extreme, an alternative is to require districts providing special education to nonresident students to pay the entire cost of doing so. However, without additional funding for these districts, we think this alternative poses risks that these districts would face higher cross subsidies to pay for their special education programs. For charter schools, this measure would be particularly difficult to fund as they do not have legal authority to seek an operating referendum from voters. Further, it may be possible to sufficiently change incentives by sharing responsibility for special education.
Sharing costs between resident districts and enrolling districts would require changes to multiple statutes, in particular, Chapter 125A of Minnesota Statutes, which focuses on special education. For instance, Minnesota Statutes 2012, 125A.11, specifies how special education aid to a resident district is currently reduced when a student receiving special education receives services outside the district.[23] Changes would have to detail the proportion of the cost the serving district or charter school would be expected to pay, as well as whether certain components, such as debt service costs, would be included in the calculation of costs.
Sharing responsibility for educating nonresident students receiving special education is part of a proposal made by the 2012 MDE task force charged with reviewing education finance. Under the task force’s proposal, enrolling districts would bear partial financial responsibility (a proposed 10 percent) for the unreimbursed costs of special education services for open-enrolled students.[24]
Some educators and advocates we spoke with said sharing responsibility for funding special education would have little impact on serving districts’ service decisions, while others wondered how they could continue paying for existing special education programs when they were required to also help fund open-enrollment students. Sharing funding responsibility is likely to be resisted by districts that would have to pick up part of the costs of serving nonresident students. For instance, charter school representatives told us such a proposal would “hamstring” them because, unlike independent school districts that can turn to operating levy referenda, charter schools have no mechanism to levy additional funding. Further, they said charter schools would be at a disadvantage in comparison with other districts because charters face restrictions on borrowing money, as well as market rate interest costs, which could constrain their ability to pay a share of special education expenses. In addition, other educators said requiring the serving district to bear some of the funding responsibility could negatively impact that district’s ability to provide specialty programs that attract students from outside districts.
Several advocates and school business officials we interviewed expressed concern about the potential for discriminatory enrollment practices if enrolling districts were required to partially pay for special education of open-enrolled students. They worried that districts would find ways to refuse enrollment to children who require a high level of service. If laws are modified as we suggest, MDE should monitor school districts to ensure discriminatory practices are not allowed.
[Sidebar]
Due to the federal “maintenance-of-effort” requirement, some school officials felt hampered in their attempts to control costs of special education.
[End of Sidebar]
Maintenance of Effort
Federal requirements can create disincentives for cost controls in special education spending. We learned that:
· Federal regulations require school districts to maintain their prior-year level of spending on special education, which can deter efforts toward cost savings.[25]
This is referred to as the “maintenance-of-effort” requirement. School districts lose eligibility for federal funding if they fail to spend at least as much in a given year as they did the previous year. Exceptions to the requirement can be approved only under limited circumstances. One exception is when special education staff depart, such as by retirement. Another is when special education enrollment decreases. A third is when a student with a disability that requires an “exceptionally costly” program either leaves the district or no longer needs or is eligible for that program. Finally, waivers may be granted when long-term expenditures, such as school facility construction, are terminated or when the state assumes responsibility for a high-cost program formerly run locally.
In talking with school district personnel, we learned that this federal requirement is viewed as a deterrent to cost efficiency. Several directors of special education told us that even when they could make changes that maintain the quality of services for less money, this requirement prohibits them from doing so. They believe the potential loss of federal funding is a disincentive to controlling increases in special education costs.
[1] Fiscal year 2011 corresponds to the 2010-2011 school year.
[2] This is a ratio of statewide enrollment in the current year to that in the previous year.
[3] A similar growth factor was used prior to fiscal year 2004 but had not been used in the intervening years; statewide aid was statutorily raised, however, in each of fiscal years 2008 through 2011.
[4] Starting in fiscal year 2012, the capped amount of excess cost aid is increased 2 percent annually and adjusted by the change in number of students between the current and prior years.
[5] Only school districts have to cross subsidize special education. Charter schools and cooperative entities do not have cross subsidies because special education costs are reimbursed by the students’ resident districts.
[6] Data are not available on the breakdown of the cross subsidy paid by general education revenues versus local school district operating levy referenda.
[7] Minnesota Statutes 2012, 127A.065 requires MDE to report annually on the amount each school district cross subsidizes special education costs with general education revenue.
[8] MDE calculates a rate of instructional costs using the ratio of instructional costs to all instructional and noninstructional costs for each district. MDE multiplies the instructional rate by each district’s general education revenues per student to arrive at an adjusted general education revenue per student. MDE multiplies this adjusted general education revenue by the portion of a day that certain students spend outside the general classroom. It is applied only to those students who receive special education outside the general classroom for at least 60 percent of a day. The product represents an additional sum of revenues assigned to pay for special education. However, such revenues do not include (1) general education revenue for noninstructional purposes (such as a school counselor) for all students in special education, or (2) instructional portions of general education revenues attributable to students in special education who are served largely in the general classroom.
[9] MDE is unable to include federal funding because of differences in how cooperative entities allocate federal aids to their member school districts. Because state aid constitutes the bulk of state and federal aid for special education, it is feasible to analyze data limited to only state revenues, but it produces a less precise estimate than it would if federal funding could be included.
[10] One of the state’s 337 school districts was calculated to have a negative school district cross subsidy because its dedicated revenues for special education exceeded its spending on special education; therefore, it is not counted with the others that paid a cross subsidy.
[11] We defined regional centers as communities with 10,000 or more in population as of 2011 and located outside of the seven-county metropolitan area.
[12] The “adjusted pupil unit” is a count of students attending public school that reflects the percentage of time students were enrolled and is weighted by grade level. It also accounts for students who attended school outside their resident district.
[13] This does not include general education revenues except for a few uncommon instances, such as when districts contract with a nonpublic school agency to meet a student’s special education needs.
[14] Even though MDE records expenditure data by different funding sources, data are not available from federal sources for fiscal years 2010 and 2011 due to data lost when a new data system was implemented.
[15] In this section, expenditures are of (1) federal special education dollars combined with (2) state regular special education revenue and excess cost revenue; they do not include the state’s general education revenues, with only small, uncommon exceptions.
[16] Because federal expenditure data were not available for fiscal years 2010 and 2011, the most recent year of full data is fiscal year 2009.
[17] Although the amount reported here includes payroll paid for all types of special education workers, state resources may be used only for salaries of essential personnel—teachers and other support services staff who provide direct services to students with disabilities. State resources may not be used to pay for salaries of those, such as special education directors, who do not provide direct services to students.
[18] Developmental cognitive disabilities is a single disability category under Minnesota Rules 2007, 3525.1333; however, the rule recognizes two different ranges of the disability (mild-moderate and severe-profound), and districts separate students by the severity of their disability for state reporting purposes.
[19] The working group’s proposal sets four cost settings, and the highest setting is for students with these disabilities: developmental cognitive disorder (mild-moderate and severe-profound ranges), physically impaired, visually impaired, and deaf-blind.
[20] Federal data used to calculate FTEs were not fully available in fiscal years 2010 and 2011. Thus, the increase in FTEs since 2000 is likely somewhat understated.
[21] Minnesota Statutes 2012, 124D.03, subd. 1(a). School districts may limit the number of nonresident students who enroll to the lesser of either 1 percent of enrollment at each grade level or the number of their resident students who enroll elsewhere. School boards must set specific standards to reject a student’s application to enroll; such standards may include the capacity of a classroom or school building. Districts may refuse an application for open enrollment when the student has been expelled for specific offenses, such as possessing a dangerous weapon.
[22] Minnesota Statutes 2012, 127A.47, subd. 7(e); and Minnesota Rules 2007, 3525.0800, subp. 8.
[23] Minnesota Statutes 2012, 125A.11, subd. 1(b).
[24] The proposal exempts certain schools, such as cooperative entities and charter schools whose enrollment is at least 80 percent students in special education.
[25] 34 CFR sec. 300.203(a).
Chapter 4 - Compliance
A key responsibility of the Minnesota Department of Education (MDE) is the general supervision over special education, as mentioned in Chapter 1. The federal government requires states to assure compliance with federal regulations on special education. Minnesota rules require that MDE periodically monitor local education agencies (LEAs) for compliance with both federal and state requirements.[1] We found that:
· Overall, the Minnesota Department of Education has a comprehensive process for assuring local education agency compliance with special education requirements, but local education agencies have expressed confusion about the process.
In this chapter, we focus on how MDE fulfills its compliance responsibility. First, we examine part of the department’s process for assuring LEA compliance with federal and state requirements. We also analyze the process for resolving disputes that arise when parents have concerns about their children’s special education. Finally, we discuss Minnesota’s compliance with federal reporting requirements.
Assuring Compliance
The U.S. Department of Education oversees states’ implementation of the Individuals with Disabilities Education Act. It does this through state-developed performance plans in which each state evaluates its efforts in implementing the act. Federal law specifies what information states are to collect and report in the plans, and it specifies three priority areas: the provision of free and appropriate public education in the least restrictive environment; the state’s supervisory authority in areas such as “child find”; and disproportionate representation of racial and ethnic groups in special education. The Office of Special Education Programs, within the U.S. Department of Education, is responsible for this oversight.
[Sidebar]
Minnesota’s Department of Education monitors school districts to determine compliance with legal requirements governing special education.
[End of Sidebar]
MDE conducts monitoring to determine school district compliance with laws and rules for special education. The federal government requires this compliance monitoring and also obligates the state to take steps to correct noncompliance when it is found. MDE’s monitoring process, implemented in 2008, consists of a five-year cycle of activities to monitor all local education agencies.
During the first year of the cycle, the LEA conducts a self-review of a sample of its records.[2] MDE provides checklists that LEAs may use to determine how well their records comply with federal and state requirements. In the second year, the LEA is to correct all areas of noncompliance found during the self-review. During the third year, MDE monitors visit the LEA and review the student records from the self-review to ensure all instances of noncompliance have been corrected. Monitors conduct interviews with special education directors and staff, as well as with general education staff. They also observe students in the classrooms, review the LEA’s facilities, and review certain required documents. If monitors identify noncompliance that has not been corrected, the LEA must make corrections during the fourth year of the cycle; it must also implement a corrective action plan that describes steps the LEA will take to ensure future compliance. In the fifth year, the LEA is free from monitoring duties while MDE verifies that the corrective action plan has been implemented. The cycle then restarts.
[Sidebar]
Compliance is monitored through self-reviews by local education agencies and department follow-up.
[End of Sidebar]
We interviewed MDE staff about the five-year monitoring process and reviewed a sample of corrective action plans. In our assessment of MDE’s process, we found that:
· The Minnesota Department of Education has comprehensive monitoring practices and requires local education agencies to achieve full compliance with requirements, as required by the federal government.
In MDE’s process, the department monitors compliance with both federal and state requirements. The federal government requires local education agencies to comply with its regulations for 100 percent of their cases. As a result, MDE’s process requires school districts to take corrective actions on every instance of noncompliance. Department employees monitor both program and fiscal requirements, as explained in the following sections.
Program Monitoring
MDE monitors special education programs on everything from timeliness of conducting evaluations to standards on services for students transitioning from high school to adulthood. As part of self-review, an LEA assesses its own compliance by reviewing a sample of its student records (the sample size varies by the number of special education students). A student’s records consist of multiple documents, including the student’s individual education program (IEP), progress reports, and prior written notices, among other items. As mentioned, the department has developed checklists for the self-review to assist districts in checking compliance with state and federal requirements. When districts find items out of compliance, they have three months to make corrections on their own. After this period, MDE examines the results and issues a citation for any items that remain out of compliance. Districts have a year to correct these citations.
The department maintains a list of citations issued for noncompliance and tracks those that have been corrected. For example, from about 90 school districts monitored in the 2011-2012 school year, 335 records had been cited for noncompliance with rules related to measurable goals and short-term objectives in the IEP. Of those 335 records cited, 148 had been corrected by the end of that school year and 187 remained to be corrected in the upcoming year.
[Sidebar]
The department must ensure that school districts correct all instances of noncompliance in their special education records.
[End of Sidebar]
To comply with federal requirements, MDE must ensure that school districts correct all cited noncompliance. In 2008, the U.S. Department of Education strengthened its requirements for states’ compliance processes. First, it required states to report all instances of noncompliance, whether they were found during a school district’s self-review or when the state monitored on-site. Second, for certain compliance items, it required states to ensure that each local district has corrected every documented instance of noncompliance, unless the student involved was no longer served by the district.
Fiscal Monitoring
MDE follows a three-tiered process for monitoring compliance with fiscal requirements. To determine which tier to use, MDE conducts a risk analysis of the LEAs in question; only the high-risk districts require the third tier.[3] The first tier is a basic desk review, and the tool used by MDE monitors for the fiscal year 2011 data monitoring contained 16 compliance items. It included items such as whether the district used a systematic process to determine appropriate levels of staffing for special education. Exhibit 4.1 lists the 16 items. Compliance items are based on requirements in federal regulations and Office of Management and Budget provisions. Of the 90 LEAs that MDE monitored for fiscal year 2011 data, about 60 percent (55 LEAs) underwent the basic desk review.
The second tier of fiscal monitoring is a comprehensive desk review. For fiscal monitoring in 2011, the comprehensive desk review tool included the 16 compliance items from the basic review, plus an additional 5 for a total of 21 compliance items. One example of an additional compliance item is whether the district applied a workload analysis in its determination of necessary and reasonable staffing levels for special education. Exhibit 4.1 lists the additional items in the second tier of fiscal monitoring. For fiscal year 2011 data, 26 LEAs were the subject of a comprehensive desk review.
The third tier of the department’s fiscal monitoring is a site visit. Site visits include interviews with special education administrators and teachers, observations of students and facilities, and record reviews. The 2011 monitoring tool for a site visit included the 21 compliance items contained in the second tier
Exhibit 4.1: Compliance Items in the Minnesota Department of Education’s Three Tiers of Fiscal Monitoring, Fiscal Year 2011
|
First Tier—Basic Desk Review of Whether the Local Education Agency: |
||||||
|
|
|
|
|
|
|
|
|
1. |
Used a systematic process based on services identified in student individual education programs (IEPs) to determine the necessary and reasonable personnel |
|||||
|
|
|
|||||
|
2. |
Maintained documentation for staff compensation paid with federal funds |
|||||
|
|
|
|
|
|
|
|
|
3. |
Maintained documentation for staff compensation paid with state funds |
|||||
|
|
|
|
|
|
|
|
|
4. |
Had a documentation procedure that supported the dissemination of special education transportation needs |
|||||
|
|
|
|
|
|
|
|
|
5. |
Demonstrated that transportation expenses charged to special education funds were based on transportation being identified as a related service in student IEPs |
|||||
|
|
|
|
|
|
|
|
|
6. |
Had purchasing processes compliant with all federal purchasing process requirements |
|||||
|
|
|
|
|
|
|
|
|
7. |
Demonstrated a process to assure compliance with their purchasing procedures |
|||||
|
|
|
|
|
|
|
|
|
8. |
Implemented procedures to ensure that procurement for special education was based on student needs and represented eligible costs |
|||||
|
|
|
|
|
|
|
|
|
9. |
Maintained property records of equipment purchased with special education funds |
|||||
|
|
|
|
|
|
|
|
|
10. |
Completed within the past two years a physical inventory of equipment purchased with special education funds |
|||||
|
|
|
|
|
|
|
|
|
11. |
Implemented procedures to seek reimbursement for medical services from Medical Assistance and other insurers |
|||||
|
|
|
|
|
|
|
|
|
12. |
Spent the required amount of federal allocation to provide coordinated early intervening services |
|||||
|
|
|
|
|
|
|
|
|
13. |
Documented that public expenditures were used for only the special needs of students enrolled in private schools |
|||||
|
|
|
|
|
|
|
|
|
14. |
Spent the required proportional amount of its federal funds to provide special education services to eligible students enrolled in private schools |
|||||
|
|
|
|
|
|
|
|
|
15. |
Maintained accounting records which separately tracked the receipt and use of local and state funds and each federal award for special education |
|||||
|
|
|
|
|
|
|
|
|
16. |
Submitted quarterly reports of jobs created and retained with federal American Recovery and Reinvestment Act funds (if such funds were used for this purpose) |
|||||
|
|
|
|
|
|
|
|
|
|
|
|
|
|
|
|
|
|
|
|
|
|
|
|
|
Second Tier—Additional Items for Comprehensive Desk Review of Whether the Local Education Agency: |
||||||
|
|
|
|
|
|
|
|
|
17. |
Applied workload analyses to attain only necessary and reasonable staffing levels |
|||||
|
|
|
|
|
|
|
|
|
18. |
Demonstrated receipt of written prior approval when required for select expenditures |
|||||
|
|
|
|
|
|
|
|
|
19. |
Provided parents with written notice of intent to seek reimbursement for medical services without parents incurring an expense |
|||||
|
|
|
|
|
|
|
|
|
20. |
Documented timely and meaningful consultation to budget the proportionate share amount required to serve private school students |
|||||
|
|
|
|
|
|
|
|
|
21. |
Obligated any remaining amounts of federal funds for eligible students enrolled in private schools during a carry-over period of one additional year |
|||||
|
|
|
|
|
|
|
|
|
|
|
|
|
|
|
|
|
|
|
|
|
|
|
|
|
Third Tier—Additional Items for Site Visit Review of Whether the Local Education Agency: |
||||||
|
|
|
|
|
|
|
|
|
22. |
Compared actual to budgeted payroll expenditures on a quarterly basis and made necessary adjustments |
|||||
|
|
|
|
|
|
|
|
|
23. |
Ensured adequate maintenance and safeguards to prevent loss, damage, or theft of nonconsumable special education inventory |
|||||
|
|
|
|
|
|
|
|
|
24. |
Demonstrated that inventory purchased with special education funds are consistently available and used primarily for special education purposes |
|||||
NOTES: The Minnesota Department of Education has a three-tiered process for monitoring local education agencies’ compliance with fiscal requirements. Agencies at high risk of noncompliance are in the third tier and monitored on more items than lower risk agencies.
SOURCES: Minnesota Department of Education, “Special Education Fiscal Monitoring Tool: Basic Desk Review” (Roseville, January 3, 2011); “Special Education Fiscal Monitoring Tool: Master Comprehensive” (Roseville, January 3, 2011); and “Special Education Fiscal Monitoring Tool: Master Site” (Roseville, January 3, 2011).
plus three additional items. An example of an additional compliance item is: whether the district demonstrated that it used special education funds to purchase inventory that is used primarily for special education purposes. For fiscal year 2011 data, nine LEAs underwent site visits.
Monitoring Student Eligibility for Services
Part of MDE’s monitoring is determining LEA compliance with legal requirements pertaining to student eligibility for special education. The department developed a “Record Review Checklist,” which LEAs may use as part of their self-review; it contains more than 35 items pertaining to student eligibility. MDE also developed eligibility checklists that LEAs may use to determine how well their evaluations of students’ disabilities comply with eligibility requirements. We compared the department’s guidance with Minnesota rules and found:
· The Minnesota Department of Education’s checklists and monitoring adequately assure compliance with state requirements pertaining to students’ eligibility for special education.
All items in MDE’s “Record Review Checklist” for LEAs’ self-review are based on state and federal requirements. Not every state rule related to student evaluations is on the checklist, but many rules not specifically included are covered by other provisions elsewhere. For instance, one rule requires that, before evaluating a student, school districts must first obtain informed consent from a parent.[4] While MDE’s checklist does not have a specific line item verifying that such consent was obtained, it does have a provision verifying that the district conducted the evaluation within 30 school days from the date the district received parental permission to proceed.[5] By being monitored on this latter rule, LEAs are in effect being monitored on the former. MDE staff acknowledged that not every element of each rule is monitored, but explained that MDE focuses on (1) what has been determined to be the central and critical pieces of the compliance process and (2) what is most responsive to the federal government’s requests for data.
[Sidebar]
Local education agencies may use checklists developed by the department to determine how well they comply with legal requirements pertaining to students’ eligibility for special education.
[End of Sidebar]
As mentioned, MDE’s student eligibility checklists help LEAs determine compliance with requirements on student eligibility. As an example, MDE has a checklist for determining compliance with whether a child is eligible in the category of autism spectrum disorders. The document contains more than a dozen compliance items, and each is based on a specific state rule.
During monitoring, LEAs and MDE assess compliance items that pertain to students’ eligibility for special education; LEAs must take actions to correct instances of noncompliance. For instance, one item deals with the state rule requiring districts to complete evaluations of student eligibility within 30 school days of receiving parental permission.[6] For the 2011-2012 school year, MDE found that 101 records were out of compliance and 72 of them had been corrected by the end of the school year. The remaining cases remained to be corrected within a year.
Compliance Issues
While MDE’s monitoring is based on compliance with federal and state requirements, not all decisions regarding compliance are black or white. Some involve judgments made by monitoring staff and LEAs. We visited eight LEAs as part of our evaluation and interviewed teachers and special education directors about the monitoring process; Appendix A provides background information on them. We spoke about the process with representatives of Minnesota Administrators for Special Education (a statewide association of special education directors) and with representatives of Education Minnesota’s Special Education Committee. We also interviewed MDE staff regarding monitoring. We found:
· The Minnesota Department of Education’s views of its monitoring process diverge from perceptions held by some special education teachers and directors of special education, which has led to confusion about the process.
[Sidebar]
Many educators we interviewed were concerned about what they viewed as petty or inconsistent decisions regarding their compliance with special education requirements.
[End of Sidebar]
Numerous educators we interviewed voiced concerns about what they viewed as inconsistent or petty compliance decisions imposed by MDE monitors. At the same time, MDE pointed out that the districts themselves—not MDE monitors—identify instances of noncompliance during their self-review year. MDE said its monitors’ duty is to review the districts’ work and verify whether noncompliance identified by districts have been corrected appropriately. According to MDE, department monitors may in some instances identify additional items of noncompliance as they review an LEA’s corrections. But MDE said that LEAs themselves, for the most part, identify noncompliant records originally. In the next sections, we examine differences between LEAs and MDE regarding inconsistent monitoring results, identification of trivial noncompliance, and department training of LEAs on compliance.
Inconsistency
During our interviews, we heard special education directors and teachers identify problems they perceived as inconsistency between monitors or over time. Staff representing multiple LEAs said they were told one thing by one monitor but a different thing by another monitor. They spoke of the time burden involved when one monitor’s decision on a document differed from that of a separate monitor. Other educators said that certain items found out of compliance in their documents had been correct when the documents were originally written—sometimes years earlier. They complained that when monitors’ judgments resulted in the need to make changes to IEPs, teachers had to meet with parents and obtain their signatures on the IEPs, even when the noncompliant items were correct at the time the reports were written. Teachers said parents found this confusing and the process was not parent-friendly.
When asked about this issue, MDE staff described the steps they take to provide consistency in the monitoring process. The steps include providing district staff with heavily scripted training on the self-review process. All training sessions follow the same script; consequently, all compliance staff in MDE’s Compliance and Monitoring Division know precisely what districts are being told in training and can apply these same answers to questions posed to them. In answering such questions, division staff try to focus on analyzing the situation globally instead of answering a question that is specific to a particular student. In addition, to encourage consistency, the division holds periodic sessions in which all the monitors meet and work through record corrections together. This allows the staff to talk about questions they have and work out their differences in advance of answering districts’ questions.
[Sidebar]
Department staff reported taking several steps, such as heavily scripted training, to provide consistency in the monitoring process.
[End of Sidebar]
Further, although regulations pertaining to compliance change over time, MDE staff described procedures they follow to ensure that every IEP is held to the standards in place when it was written. First, monitors keep two sets of standards to reflect current legal requirements as well as those that had been in place previously; they can check either as the need arises. Second, when standards have been modified, MDE’s compliance database has drop-down menus that reflect both sets of standards. Users have the option of selecting the standard appropriate for the time a document was written. Third, when laws, rules, or regulations change, MDE’s entire division receives training on the new requirements. In addition, MDE monitors train each other as they prepare to train district staff; part of this process involves thinking through how last year’s training went and where MDE saw evidence of noncompliance. Division staff use those assessments to revamp their internal training, deliver the training to others in the division, and then prepare to train district staff.
Trivial Noncompliance
Some educators we interviewed during our site visits voiced concern with monitor decisions on items of seemingly insignificant value. In one example, a teacher said that she had neglected to denote the ophthalmologist credentials alongside the name of an ophthalmologist who had conducted a test used in a student’s evaluation. She considered the mistake to be more of a typo than a substantive change but was still required to redo the evaluation and its tests after a monitor identified the error. As a result of what one special education director we visited viewed as excessive scrutiny from the MDE monitoring process, the director compiled a 36-page document for the LEA’s teachers based on expectations of MDE monitors. The document shows examples of both compliant and noncompliant wording and is intended to guide teachers as they write prior written notices, evaluations, and IEPs.
[Sidebar]
Educators we interviewed explained they had to completely redo evaluations of student eligibility to address what amounted to little more than typos identified during compliance monitoring.
[End of Sidebar]
Further, educators questioned monitoring decisions that appeared overly concerned with a teacher’s word choice even when the word seemed to make little or no substantive change to a document’s meaning. Educators complained that monitors’ decisions of this type could result in extra work for teachers with no appreciable gain. They also said making such changes required additional IEP team meetings, prior written notices, and parent signatures. As an example, they said that monitors cited an IEP because it contained the phrase “seven out of ten times” instead of “70 percent.” When asked about this example, MDE staff told us that department monitors have not been instructed to cite that type of record or return it for correction. They said the division bases monitoring decisions on regulations, which require IEP goals to be measurable.[7] In addition, MDE staff said, by definition, goals should be future-oriented. MDE staff said the use of either “seven out of ten times” or “70 percent” meets the standard of being measurable.
In another example, district staff told us that, based on a monitor’s decision, teachers were instructed to no longer write goals expressed by students using language such as “I would like to go to college”; instead, they were told to use the phrasing “I will go to college.” Educators found this nuance in language difficult to justify.
In response to this example, MDE staff said that “I would like” is a present-level statement, meaning that the goal is in the present tense and is inappropriate because the goal is already accomplished; instead, it should reflect what a student aspires to achieve. Federal regulations do not specifically require that a goal is to be future-oriented, and MDE staff agreed in this instance that no rule requires the language “I will.” However, MDE stated that U.S. Department of Education guidance suggests that the term “postsecondary goals” is generally understood to mean goals to be achieved after high school, that is, at a future time.[8] Further, MDE pointed to a state rule that requires IEPs to include a statement of the student’s progress toward annual goals.[9] They said if a goal is to measure student progress, it must be future-oriented.
Discrepancies on Training
MDE offers LEAs training on its monitoring process, but department staff and some educators expressed discrepancies regarding it. As mentioned earlier, MDE staff said they purposely follow the same script during training sessions to attain consistency. Yet, in our interviews, we heard from some special education directors who said MDE’s training is done poorly or is overly prescriptive and focused too much on minute details. One called for more meaningful staff development that allows for back-and-forth discussion and explanations of legal requirements. In response to a question about confusion over monitoring among teachers we interviewed, MDE staff said that districts typically send special education directors and due process staff, not teachers, to the training sessions. MDE staff said when teachers do attend, teachers tend to ask practical questions stemming from their experience in the field. They indicated uncertainty over how well information from the training is filtering down to the teachers who actually write the IEP goals and other required documents.
[Sidebar]
Department staff questioned how well its training reaches the special education teachers who must comply
with legal requirements.
[End of Sidebar]
We reviewed the presentations that MDE has followed in recent training sessions on the self-review process; MDE uses hundreds of slides over the course of a nearly three-day training session. The slides are detailed, which is necessary given the volume of state and federal requirements that apply to special education. Most of the slides refer directly to an applicable law, rule, or regulation. For instance, slides describing criteria for determining a student’s eligibility in the category of specific learning disabilities contain references to Minnesota Rules 3525.1341, which define that disability. Although we did not personally observe MDE training, we examined results from recent participants’ evaluations. In response to open-ended questions on the learning and scheduling formats of the training, participants gave the training a mix of positive and negative reviews. The two most common complaints were that (1) the material was complex and hard to synthesize and (2) the training took a long time.
RECOMMENDATION
The Minnesota Department of Education should evaluate its monitoring process to identify ways to improve special education teachers’ understanding of compliance requirements.
While we think the concerns expressed by special education directors and teachers were genuine, we also recognize MDE’s efforts to improve consistency in the monitoring process. The focus of our recommendation is ensuring that special education teachers understand the standards for compliance, including what is necessary to write IEPs and other documents compliant with legal standards. As part of this recommendation, the department should identify ways to ensure that teachers have sufficient written and online resources to make decisions on what is and is not compliant with legal requirements.
[Sidebar]
Special education teachers need sufficient resources to make decisions on what is and is not compliant with legal requirements.
[End of Sidebar]
We believe it will be important for the department to work with LEA staff and their associations, including Education Minnesota and the Minnesota Administrators of Special Education. A collaborative effort is needed to identify obstacles to, and solutions for, confusion over what is required and why.
Additional training may be needed directly with special education teachers, which can raise questions about cost and timing. During the school year, training for teachers takes them out of their classrooms, often requiring LEAs to hire substitute teachers. Training during summer months may involve renegotiating provisions in teacher contracts. Compliance is important for the sake of meeting legal requirements but equally important for the sake of educating students who receive special education and tracking their progress. We believe the value of well-understood compliance overrides potential logistical and financial issues tied to improving teachers’ understanding.
Resolving Disputes
Federal and Minnesota requirements lay out multiple methods that parents may use when they disagree with a school’s actions related to special education for their children. The methods are part of the procedural safeguards in law and regulation regarding a free and appropriate education for children with disabilities and their parents.
Methods for resolving disputes may involve using one or more of four options: (1) due process hearings (the most formal of the four), or alternative dispute resolution, consisting of (2) conciliation conferences, (3) mediations, and (4) facilitated IEP meetings. An unknown number of parents’ issues are resolved informally before parents invoke any of these four methods. Parents do not have to avail themselves of alternative dispute resolution; they can proceed directly to a due process hearing if they wish.
[Sidebar]
When parents dispute a school district’s decision regarding special education for their child, they may use any of four different methods to resolve the dispute.
[End of Sidebar]
Federal regulations require the availability of due process hearings.[10] The hearings are formal legal proceedings that are held after a party files a due process complaint. The complaint must contain certain information including a description of the nature of the problem and a proposed resolution. When a request for a hearing comes into MDE, the department’s role is limited to asking Minnesota’s Office of Administrative Hearings to schedule a hearing and appoint a hearing officer. MDE pays the bill for such hearings. If parties to hearings are dissatisfied with the hearing results, they may appeal decisions to the Minnesota Court of Appeals or in federal district court.
Conciliation conferences are offered and held by school districts and voluntary for parents. They are meetings intended as a means to resolve disputes more informally than through formal hearings. State rules require districts to offer conciliation conferences if parents object to any proposal or refusal of service related to special education.[11]
Federal regulations require school districts to offer mediations to parents as a method for resolving disputes.[12] Impartial mediators are required to preside. MDE staff told us mediation is commonly used when there are communication problems between the district and parents. By contrast, facilitated IEP meetings tend to be held when disagreements center around the student’s educational program. Such meetings are managed by facilitators who are independent, neutral mediators trained to help parties negotiate the IEP planning process. To conduct mediations and facilitated IEP meetings, MDE offers services of 14 trained mediators (not MDE’s own employees).
In reviewing data on resolving disputes over special education, we found that:
· Between fiscal years 2002 and 2012, the numbers of complaints filed by parents have decreased significantly, as have the numbers of mediations, facilitated IEP meetings, and formal hearings.
Over an 11-year period starting in fiscal year 2002, complaints declined from 232 to 51. MDE does not have data on the number of conciliation conferences because such conferences are managed locally by school districts.
MDE data on methods for resolving parents’ complaints show the following. Over a seven-year period from fiscal year 2006 through 2012 (when comparable data were collected), the numbers of mediations held were relatively constant, with a median 46 per year, until they declined to 25 in fiscal year 2012. Similarly, the numbers of facilitated IEP meetings that were held dropped from 36 in fiscal year 2006 to 21 in fiscal year 2012. The number of requested due process hearings (the most formal method of dispute resolution) dropped from 49 in fiscal year 2002 to 38 in fiscal year 2012. The number of such hearings that were actually held declined from 15 to 2 over that time (the remainder were withdrawn, dismissed, or settled prior to the hearing). Exhibit 4.2 details the trends.
Exhibit 4.2: Numbers of Complaints and Alternative Dispute Resolution, Fiscal Years 2002-2012
|
|
Fiscal
Year |
Fiscal
Year |
Median |
Percentage Change 2002-2012 |
|||||
|
|
|
|
|
|
|||||
|
Complaintsa |
232 |
51 |
113 |
-78% |
|||||
|
|
|
|
|
|
|||||
|
|
|
|
|
|
|||||
|
|
Fiscal
Year |
Fiscal
Year |
Median |
Percentage Change 2002-2012 |
|||||
|
|
Requested |
Held |
Requested |
Held |
Requested |
Held |
Requested |
Held |
|
|
|
|
|
|
|
|
||||
|
Hearings |
49 |
15 |
38 |
2 |
38 |
7 |
-22% |
-87% |
|
|
|
|
|
|
|
|||||
|
|
|
|
|
|
|
|
|
|
|
|
|
Fiscal
Year |
Fiscal
Year |
Median |
Percentage Change 2006-2012 |
|||||
|
|
Requested |
Held |
Requested |
Held |
Requested |
Held |
Requested |
Held |
|
|
|
|
|
|
|
|
||||
|
|
|
|
|
|
|
|
|
|
|
|
Mediationsb |
70 |
46 |
47 |
25 |
70 |
46 |
-33% |
-46% |
|
|
Facilitated IEP Meetingsb |
44 |
36 |
28 |
21 |
41 |
33 |
-36 |
-42 |
|
NOTE: Minnesota also requires the availability of conciliation conferences to resolve disputes, but data on the number held are not available.
a Includes both formal and informal complaints, with the majority each year being formal complaints.
b Data are from fiscal years 2006 through 2012 because data in earlier years were counted differently and are not comparable.
SOURCE: Office of the Legislative Auditor, analysis of Minnesota Department of Education’s data on Minnesota Special Education Dispute Resolution, fiscal years 2000-2012.
The reason for the declining number of complaints and steady or declining use of dispute resolution is unknown. The reduction could indicate general satisfaction with special education, especially given the fact that the number of enrolled children receiving special education increased during the period that complaints declined. A survey we conducted of a small number of parents indicated generally high levels of satisfaction with special education; however, the 11 parents’ responses we received was too small a number to be generalizable statewide.
In addition, MDE surveys parents regarding the efforts school districts make to involve parents in their child’s special education decisions. MDE collects data on parent involvement and participation through a 28-item parent survey administered during its monitoring process. Results are also reported in the department’s federally required annual performance report. The responses to all survey items are averaged to come up with whether an individual parent feels the school district facilitated parent involvement. We analyzed individual survey items over four years of school district-administered parent surveys (1,874 parent surveys total). Our analysis showed that high rates of parents of students receiving special education who responded to MDE’s survey expressed agreement that their schools facilitated parent involvement.
The survey data cannot explain directly the decline in the number of complaints. Data are not available to determine whether respondents to the survey had filed complaints or participated in dispute resolution. The results may be viewed, along with declining numbers of complaints, as a general indicator of parent satisfaction, but additional research would be needed to fully understand the reasons behind the declining number of complaints.
MDE staff speculated that the decrease in the number of complaints may be attributable to department (1) efforts to help parents resolve issues before they rise to the level of a formal complaint and (2) monitoring practices that identify school districts’ noncompliance before they become incidents. One should be cautious about automatically assuming that the decreases in the number of complaints is necessarily all positive. As certain advocates have suggested, the decline in number of complaints could be due in part to parents’ perception of the dispute resolution process as time consuming or too contentious.
Federal Compliance Monitoring
Federal regulations require states to submit a state performance plan to the U.S. Department of Education. States’ performance plans are intended as a means of evaluating a state’s implementation of particular requirements of the Individuals with Disabilities Education Act. The plan, which is written to cover several years, includes targets, baseline data, and evaluation methodologies for 20 predetermined indicators, which we introduced in Chapter 1.[13] Every year MDE must produce an annual performance report that details Minnesota’s performance on the indicators with respect to targets set in the state performance plan. Nine of the indicators measure compliance, one measures both compliance and results, and the other ten measure results only. MDE submits the plan and the annual performance report to the U.S. Department of Education’s Office of Special Education Programs.
[Sidebar]
States are required to submit performance plans and annual reports that evaluate their implementation of federal requirements for special education.
[End of Sidebar]
In reviewing a state’s performance plan and annual performance report results, the Office of Special Education Programs makes one of four determinations regarding the state’s efforts to implement the requirements of Part B of the Individuals with Disabilities Education Act: (1) the state meets federal requirements, (2) the state needs assistance to implement requirements, (3) the state needs intervention to implement requirements, or (4) the state needs substantial intervention.[14] The Office of Special Education Programs makes its determination based on whether the state submitted valid and reliable data, the number of compliance indicators for which the state achieved substantial compliance and for which the state had very low compliance, and whether the state successfully addressed all compliance problems resulting from previous reviews, among other things.
[Sidebar]
The federal government reviews states’ performance reports and determines to what extent states need intervention to implement special education requirements.
[End of Sidebar]
When a state fails to fully meet federal requirements, federal regulations describe a range of potential consequences (from which the U.S. Department of Education can choose) for each possible determination. If a state is determined to be in need of assistance for two consecutive years, the U.S. Department of Education may, for example, require the state to take advantage of available technical assistance resources, or prescribe how the state can use its state-level funding. If a state is determined to need intervention for three or more consecutive years or to need substantial intervention for any amount of time, possible U.S. Department of Education remedies include, but are not limited to, withholding further payments under Part B of the Individuals with Disabilities Education Act, seeking to recover funds from the state, and referring the matter for appropriate enforcement action, including referral to the Department of Justice.
With respect to Minnesota’s most recent federal determination:
· While Minnesota met required thresholds for most federal compliance indicators for the 2010-2011 school year, the federal government determined that Minnesota “needed assistance” to implement federal requirements because the state did not achieve sufficient compliance on two compliance indicators.[15]
The Office of Special Education Programs bases a state’s determination on its performance with respect to ten compliance indicators. The federal targets for each indicator represent complete compliance (which might be 0 or 100 percent, depending on the nature of the indicator). For example, one target is that 0 percent of districts have disproportional special education representation of racial and ethnic groups due to inappropriate identification practices; another target is that 100 percent of children are initially evaluated within 30 school days of the parents consenting to the evaluation. The federal office also sets somewhat lower thresholds that it uses to make its determinations about compliance. Each indicator has a threshold for “a very high level of compliance.” Returning to the examples above, a state would meet the threshold (and, therefore, not be cited) for disproportional representation as long as 5 percent or fewer school districts exhibited inappropriate disproportionality. A state would also meet the threshold (and avoid citation) as long as at least 95 percent of children were initially evaluated within the allowed timeframe. Certain indicators also have a lower bar for “substantial compliance,” which is set at 25 or 75 percent, depending on the nature of the indicator.
[Sidebar]
For 2010-2011, Minnesota did not meet the threshold for compliance on appropriate and measurable goals in IEPs for secondary students.
[End of Sidebar]
Although Minnesota failed to achieve complete compliance for
six of the ten compliance indicators in 2010-2011, the state met the federal
threshold for substantial compliance for all but two indicators. The
first of the two indicators cited by the Office of Special Education Programs
was on secondary transition requirements, including requirements that IEPs
contain appropriate and measurable postsecondary goals for students of 16 years
of age or older. Minnesota data showed that 57.3 percent of IEPs reviewed
included appropriate and measurable postsecondary goals, falling well short of
the federal government’s substantial compliance threshold of 75 percent (and
even further short of the 95-percent threshold for very high compliance or the
target of
100-percent compliance). MDE collected data for this indicator through
its monitoring process, during which it reviewed 736 IEPs for students age 16
and older. The department found 422 of them to be in compliance.
In its annual performance report, MDE stated that the two most frequent problems found in the secondary transition plans were (1) failure to include goals related to the student’s transition service needs and (2) lack of evidence that the student was invited to participate in the IEP meeting at which transition goals were discussed. When we examined annual performance report data, we found that only 26 percent of the local education agencies monitored during the 2010-2011 school year had 100-percent compliance with transition planning requirements. As a result of the cited noncompliance, the Office of Special Education Programs will require MDE to provide additional reporting on postsecondary goals in its next annual performance report. The department must report whether every school district found to be noncompliant is properly implementing transition planning requirements and has corrected each instance of noncompliance.
[Sidebar]
Nor did Minnesota meet the threshold for compliance on timely resolution of complaints on special education.
[End of Sidebar]
The second indicator cited by the federal Office of Special
Education programs was on timely resolution of complaints, for which
Minnesota’s data reflected
94-percent compliance. The federal threshold for compliance is 95
percent; the Office of Special Education Programs does not allow a more
forgiving standard of substantial compliance for this indicator. During
the 2010-2011 school year, MDE issued reports on 51 complaints, 48 of which were
resolved within the established 60-day timeline or by a timeline extended due
to exceptional circumstances or an agreement between parties. Had
Minnesota resolved one additional complaint within the established timeline,
the state would not have been cited for this indicator.
While the Office of Special Education Programs cited Minnesota’s performance on the two indicators as evidence that Minnesota needs assistance implementing the Individuals with Disabilities Education Act, it also noted that Minnesota has achieved high levels of compliance on seven of the ten compliance indicators. Exhibit 4.3 lists the ten compliance indicators, federal targets and thresholds, and Minnesota’s results for the 2010-2011 school year. It shows that beyond the two cited indicators, Minnesota’s results were better than the federal threshold for very high compliance for every indicator with the exception of one: in 2010-2011, Minnesota conducted 94 percent of initial evaluations within 30 school days of receiving parental consent to evaluate; it would have had to conduct 95 percent to have met the threshold for very high compliance.
Exhibit 4.3:
Federal Compliance Indicators, Targets, and Results,
2010-2011
|
Indicator Reporting Requirement |
Federal Target |
Federal Threshold for Very High Compliance |
Federal Threshold for Substantial Compliance |
State Rate |
|
|
|
|
|
|
|
|
|
4B |
Percentage of districts that have (1) a significant discrepancy in the rate of suspensions and expulsions of greater than ten days per school year for children with IEPs by race and ethnicity and (2) policies, procedures, or practices that contribute to the significant discrepancy and do not comply with requirements |
0% |
<=5% |
<=25% |
0.4% |
|
|
|
|
|
|
|
|
9 |
Percentage of districts with disproportionate representation of racial and ethnic groups in special education resulting from inappropriate identification |
0 |
<=5 |
<=25 |
0.0 |
|
|
|
|
|
|
|
|
10 |
Percentage of districts with disproportionate representation of racial and ethnic groups in specific disability categories resulting from inappropriate identification |
0 |
<=5 |
<=25 |
0.0 |
|
|
|
|
|
|
|
|
11 |
Percentage of children evaluated within 30 school days of parental consent for initial evaluationa |
100 |
>=95 |
>=75 |
94.4 |
|
|
|
|
|
|
|
|
12 |
Percentage of children referred by Part C prior to age 3, who are found eligible for Part B, and who have an IEP developed and implemented by their third birthdayb |
100 |
>=95 |
>=75 |
95.7 |
|
|
|
|
|
|
|
|
13 |
Percentage of youth age 16 and older with an IEP that includes appropriate post-secondary goals |
100 |
>=95 |
>=75 |
57.3 |
|
|
|
|
|
|
|
|
15 |
Percentage of noncompliance corrected within one year of identification of the compliance issue |
100 |
>=95 |
NA |
97.5 |
|
|
|
|
|
|
|
|
16 |
Percentage of signed written complaints with reports issued that were resolved within a 60-day timeline or a timeline extended due to exceptional circumstances or an agreement between parties |
100 |
>=95 |
NA |
94.0 |
|
|
|
|
|
|
|
|
17 |
Percentage of adjudicated due process hearing requests that were fully adjudicated within the 45-day timeline or a timeline properly extended by the hearing officer |
100 |
>=95 |
NA |
100.0 |
|
|
|
|
|
|
|
|
20 |
Percentage of state-reported data that were timely and accurate |
100 |
>=95 |
NA |
100.0 |
NOTES: The federal Office of Special Education Programs sets thresholds for levels of very high compliance with compliance indicators, represented by the first “federal threshold” column. The second “federal threshold” column gives the thresholds for substantial compliance as determined by the federal government. If a threshold for substantial compliance is listed, the federal government will not cite a state for that indicator as long as it achieves the substantial compliance threshold. If there is no threshold for substantial compliance, then states must achieve the very high threshold in order to be considered in compliance with the Individuals with Disabilities Education Act.
a The federal requirement is actually 60 days, unless the state has established a different timeline, in which case the state must report its results relative to that timeline. Minnesota requires that initial evaluations be conducted within 30 school days of receiving parental consent.
b Part C is the portion of the Individuals with Disabilities Education Act related to infants and toddlers with disabilities (from birth to age 2). Part B of the act pertains to special education and related services for children of 3 to 21 years of age.
SOURCE: United States Department of Education, Office of Special Education Programs’ determination letter to the Minnesota Department of Education, June 27, 2012.
[1] Minnesota Rules 2007, 3525.1100, subp. 1.
[2] Department staff told us that charter schools have been monitored somewhat differently; charter schools did not conduct a self-review as districts and cooperative entities did. However, in the 2012-2013 school year, charter schools were to begin conducting self-reviews for the first time.
[3] MDE calculates districts’ risk for fiscal noncompliance by analyzing numerous factors, including amount of expenditures and the share of total expenditures that special education expenditures represent. It then considers other risk factors, such as debt status and resolution of prior audit findings.
[4] Minnesota Rules 2007, 3525.2710, subp. 1.
[5] Minnesota Rules 2007, 3525.2550, subp. 2.
[6] Ibid.
[7] 34 CFR sec. 300.320 (a)(2)(i) (2006).
[8] 34 CFR, vol. 71, no. 56 (2006), 46668.
[9] Minnesota Rules 2007, 3525.2810, subp. 1A(9).
[10] 34 CFR sec. 300.511 (a) (2006).
[11] Minnesota Rules 2007, 3525.3700, subp. 1.
[12] 34 CFR sec. 300.506 (a) (2006).
[13] For most results indicators (such as on graduation rates), MDE worked with the state’s Special Education Advisory Panel to develop “measurable and rigorous targets,” as required by federal law. For compliance indicators (such as the share of children evaluated in a timely way), the federal government requires the target to be complete compliance. The targets for the past several years are enumerated in the Minnesota State Performance Plan Part B (2005-2013).
[14] Part B of the act pertains to special education and related services for children of 3 to 21 years of age.
[15] This was the first time since 2008 that Minnesota had been deemed in need of assistance. In its determination letter, the Office of Special Education Programs suggested that the state take advantage of technical assistance resources. However, Minnesota was not required to do so as the consequences listed above apply only to states that receive the needs-assistance determination for two consecutive years.
Chapter 5 - Legal Requirements
Federal and state laws contain legal requirements that govern the provision of special education to students with disabilities in Minnesota. We were asked to compare federal and Minnesota requirements because some legislators and educators have voiced concern that Minnesota has requirements that exceed those of the federal government. Requirements specific to Minnesota have the potential to increase the cost of special education and the workload of special education providers beyond that which is stipulated in federal law. These requirements may also have an impact on students’ educational outcomes.
[Sidebar]
Legal requirements specific to Minnesota may have impacts on special education costs or students’ educational outcomes.
[End of Sidebar]
In recent years, the Minnesota Department of Education (MDE), lawyers, and legislative task forces have compared federal and state legal requirements for special education and identified requirements unique to Minnesota. A legislative task force composed of special education advocates, educators, and others, completed the most recent federal and state comparison in 2008 and 2009. The task force identified Minnesota special education statutes that exceeded or expanded upon minimum federal requirements in 2008. The task force was reauthorized and completed a comparison of Minnesota rules and federal requirements in 2009. Our analysis updates the comparison and also identifies practical impacts that certain Minnesota requirements have on schools and students.
In conducting our evaluation, we found that:
· Overall, Minnesota has many special education requirements that exceed federal requirements, but detailed analyses of their costs and educational benefits are unavailable.
In this chapter, we describe some of the Minnesota requirements that exceed federal requirements in the Individuals with Disabilities Education Act and indicate which ones have the potential to increase costs or educators’ workloads. A comprehensive list of Minnesota-specific requirements is in Appendix B. We also discuss practical effects of select state requirements and expected impacts if requirements were to be changed, as expressed by the educators and advocates with whom we spoke.
requirements specific to minnesota
We compared Minnesota statutes and rules pertaining to special education to the federal requirements in the Individuals with Disabilities Education Act.[1] In making our comparison, we determined a Minnesota requirement exceeded a federal one if it went beyond the minimum quantity, degree, or rate of special education services or professional responsibilities. This included some cases in which the Individuals with Disabilities Education Act is silent on issues regulated by Minnesota statutes, such as the use of restrictive procedures.[2] It also included cases in which the federal government set a minimum standard, but specified that states may have different standards, such as shorter timelines.
Many Minnesota statutes and administrative rules exceed federal requirements for special education. Of the 45 Minnesota statutes we studied that specifically govern special education, 19 of them contain at least one provision that exceeds federal requirements.[3] An additional seven general education statutes contain requirements for special education that do not exist at the federal level.[4] In addition, nearly three-quarters of the 57 Minnesota rules we analyzed contained provisions that exceed federal requirements.[5]
[Sidebar]
About 42 percent of Minnesota statutes specific to special education and nearly 75 percent of Minnesota rules on special education that we analyzed exceeded federal requirements.
[End of Sidebar]
Besides Minnesota requirements that exceed federal ones, we also identified statutes and rules that are unique to the state, but that we concluded do not exceed federal requirements. These include certain Minnesota statutes and rules that establish guidelines or procedures required by the federal government. For example, federal regulations require states to set criteria for determining whether a child has a specific learning disability, which Minnesota has done in rule.[6] Other Minnesota requirements mandate reimbursement procedures for state special education funding and designate financial responsibility when students receive special education outside their resident districts; federal requirements do not dictate how states fund special education, so each state may develop its own system. In cases where we determined Minnesota requirements did not exceed federal, we did not compare Minnesota’s requirements to those established in other states, nor did we study their effectiveness or efficiency.
In the following sections, we describe a number of Minnesota special education requirements that exceed federal requirements. We focus on requirements that are specific to Minnesota and affect (1) the level of documentation required by teachers and administrators, (2) school district staff’s professional responsibilities, and (3) student eligibility for special education services. A detailed list of Minnesota statutes and rules that exceed federal requirements and a description of our research methodology are contained in Appendix B.
Documentation
The first category of requirements we analyzed pertains to special education documentation. Special education teachers and school administrators are required to complete paperwork that is not required of general education teachers. Paperwork significantly adds to special education teachers’ and administrators’ workloads and can have cost implications when districts hire staff to assist with it. As described in Chapter 1, federal law requires a number of processes and services that must be documented for students receiving special education. In addition, we found:
· Minnesota requires additional information in federally mandated documents as well as reports not mandated at the federal level.
[Sidebar]
Individualized education plans (IEPs) for students receiving special education in Minnesota must contain short-term objectives, in addition to federally required goals.
[End of Sidebar]
Minnesota statutes and rules require additional content in several federally required documents. For instance, the federal government requires that LEAs submit a plan that provides assurances they meet certain criteria, which is satisfied by Minnesota’s requirement for a “total special education system” document.[7] This document describes the district’s plan for providing special education instruction and related services. Under Minnesota rules, this document must contain items not required by federal law, such as a management plan.[8] Prior written notices and evaluation reports must also contain additional information.[9] The individualized education program (IEP) must contain short-term objectives or benchmarks to measure students’ progress, as well as a description of students’ needs for paraprofessional support, which are not federally required.[10]
Several documents required by Minnesota statutes and rules are not required by the federal government. Minnesota statutes, for example, require each school that intends to use restrictive procedures to maintain a plan that details the types of procedures staff may use, a description of staff training, and an explanation of how the school will monitor and evaluate the use of these procedures.[11] Before school staff may use a restrictive procedure on a student, Minnesota rules require the student’s IEP team to perform a functional behavioral assessment; the school district must also report the use of prone restraints to MDE.[12] Districts must also write a transition services evaluation report for each child between the ages of 14 and 21.[13] In addition, members of the community transition interagency committees—committees created by Minnesota to help plan for students’ transition from high school to postschool activities—have paperwork duties set in statute. Committee members must prepare a community plan detailing the committee’s mission, goals, and objectives, as well as an annual summary assessing the progress of transition services in the community.[14]
Local Education Agency Responsibilities
The second category of requirements we analyzed require LEA staff to take on certain additional duties. While federal requirements mandate a number of responsibilities for special education teachers and LEA staff, we found that:
· Minnesota special education requirements mandate duties for teachers and school administrators that are not required by federal law.
Minnesota statutes and rules add to LEA staff members’ professional responsibilities in a variety of ways. Additional responsibilities include: organizing committees, meeting staffing requirements, participating in alternative dispute resolution processes, holding IEP team meetings, and meeting timelines specific to Minnesota. These are explained below.
[Sidebar]
Minnesota requires three special education committees, including parent advisory councils, that are not required federally.
[End of Sidebar]
Committees
Minnesota requires that LEA staff organize or participate in committees not required by federal law. Three committees required in Minnesota—but not by the federal government—are interagency early intervention committees, parent advisory councils, and community transition interagency committees. School districts are required to establish these committees independently or collectively for various purposes described in Exhibit 5.1. While committee requirements may have only incidental costs, they can add to the workload of special education teachers and administrators.
Exhibit 5.1: Special Education Committees Required by Minnesota Law, 2012
|
Committee Name |
Committee Organizers |
Committee Purpose |
|
|
|
|
|
Interagency Early Intervention Committee |
School districts, groups of districts, or special education cooperatives must establish interagency early intervention committees in cooperation with local health and human services agencies. |
Governing boards of these committees must develop interagency policies and procedures at the local level to coordinate services for children with disabilities. |
|
|
|
|
|
Parent Advisory Councils |
School districts, or groups of districts in the same special education cooperative, must organize a parent advisory council. |
These councils are intended to increase parent involvement in district policy making and decision making. |
|
|
|
|
|
Community Transition Interagency Committees |
School districts, groups of districts, or special education cooperatives, in cooperation with counties, must establish community transition interagency committees. |
These committees are intended to benefit youth in 9th grade and older by exchanging agency information and developing community plans to assure the needs of students are met as they transition from high school to postschool activities. |
SOURCES: Minnesota Statutes 2012, 125A.027, 125A.22, 125A.24, and 125A.30.
[Sidebar]
In Minnesota, every school district must employ a special education director.
[End of Sidebar]
Staffing Requirements
Minnesota has staffing parameters not present in federal law, which may require LEAs to hire additional staff under specific circumstances. While we cannot enumerate the actual costs, this requirement clearly adds to the cost of special education by requiring more staff under certain circumstances. Most notably, every school district, individually or cooperatively, must employ a special education director.[15] In addition, special education teachers may be assigned only a set number of students if those students spend half of their school day or more receiving special instruction.[16] Caseload limits vary by: (1) the percentage of the school day students receive direct special instruction, (2) the students’ primary disability categories, and (3) the number of program support assistants helping the teacher.[17] For example, a teacher assisted by one program support assistant may be assigned up to four students with autism spectrum disorders if those students spend the entire school day receiving special instruction. Exhibit 5.2 details the caseload parameters.
Exhibit 5.2: Number of Students that May Be Assigned to a Special Education Teacher, 2012
|
|
Teacher |
Teacher Plus 1 Assistant |
Teacher Plus 2 Assistants |
|||
|
|
Students Attend At Least a Half Day but Less Than a Full Day |
Students Attend Full School Day |
Students Attend At Least a Half Day but Less Than a Full Day |
Students Attend Full School Day |
Students Attend At Least a Half Day but Less Than a Full Day |
Students Attend Full School Day |
|
|
|
|
|
|
|
|
|
Autism spectrum disorders |
3 |
— |
6 |
4 |
— |
6 |
|
Deaf-blind |
3 |
— |
6 |
4 |
— |
6 |
|
Developmental cognitive disabilities: severe-profounda |
3 |
— |
6 |
4 |
— |
6 |
|
Developmental cognitive disabilities: mild-moderatea |
12 |
— |
15 |
— |
— |
— |
|
Severely multiply impaired |
3 |
— |
6 |
4 |
— |
6 |
|
Specific learning disabilities |
12 |
— |
15 |
— |
— |
— |
|
All other disabilities |
— |
— |
10 |
8 |
12 |
— |
NOTES: The number of students that may be assigned to a teacher is dependent upon three things: 1) the number of teachers and program support assistants in the classroom, 2) the percentage of the school day students spend in special education, and 3) students’ disability categories. Cells with a dash (“—”) indicate situations that are not addressed by Minnesota rules.
a Minnesota rules establishing the definition and evaluation criteria for developmental cognitive disorders separate students into two categories based on the severity of their disability. Districts are required to separate students by the severity of their disability for reporting purposes at the state level, and these separate categories are used in this rule.
SOURCE: Minnesota Rules 2007, 3525.2340, subp. 4 A and B.
Dispute Resolution
Minnesota statutes and rules add several requirements to the federally mandated procedural safeguards, which are described in Chapters 1 and 4. Safeguards are intended to protect the rights of students with disabilities and their parents, and result in unspecified costs to LEAs in terms of staff time and effort to comply with requirements. Minnesota created two alternative dispute resolution methods not required by federal law. One is a conciliation conference, in which LEA administrators and teachers convene a meeting with the parents of students with disabilities.[18] The second is a “facilitated IEP team meeting,” in which MDE appoints a facilitator to work with an IEP team to reach agreement on students’ goals and services.[19] Minnesota allows school districts or parents to request a second mediation to resolve disputes over the implementation of a previously mediated agreement.[20] In addition, Minnesota requires that parties meet with a hearing officer for a prehearing conference before a due process hearing may take place.[21]
[Sidebar]
Minnesota requires offering two alternative dispute resolution methods not required by federal law.
[End of Sidebar]
Individualized Education Program Team Meetings
Minnesota statutes require IEP teams to meet under more circumstances than federal law requires, which adds to special education teachers’ and administrators’ workloads. For example, if restrictive procedures are used twice in a 30-day period and are not part of a student’s IEP or behavioral plan, the school must hold an IEP team meeting.[22] Similarly, if a student is removed from a classroom, school building, or school grounds by a peace officer at the request of school staff twice in a 30-day period, the IEP team must meet to determine whether the student’s IEP is adequate.[23] Minnesota statutes also require that relevant members of IEP teams meet when a student receiving special education has been suspended more than five consecutive or ten cumulative school days.[24]
[Sidebar]
State rules require teachers to complete initial evaluations of student eligibility for special education within 30 school days, less than the time required by the federally mandated 60 days.
[End of Sidebar]
Timelines
Minnesota statutes and rules set timelines that in some cases do not exist in federal law and in others are shorter than federal timelines. As mentioned above, conciliation conferences are not required at the federal level, nor are prehearing conferences; timelines for holding and reporting on such conferences are state-mandated.[25] In addition, Minnesota sets timelines that do not exist at the federal level for appointing hearing officers and sending prior written notices before changes are made in the student’s education.[26] Minnesota rules set timelines on when to begin providing special education to students in care-and-treatment facilities, while federal law does not.[27]
In certain instances, Minnesota timelines require quicker actions than federal ones. For example, state rules require initial evaluations to determine student eligibility for special education to be completed within 30 school days of parental consent, rather than the federally mandated 60 days.[28]
Student Eligibility
The third category of requirements we analyzed has to do with student eligibility for special education. As explained in Chapters 1 and 2, federal regulations define disability categories and set age limits for special education eligibility. We found:
· Minnesota statutes and rules differ from federal requirements in ways that may affect the number of students eligible for special education.
Differences between Minnesota and federal requirements regarding eligibility for special education services create the potential for higher numbers of students qualifying for special education, thereby increasing costs. On the other hand, some Minnesota requirements may create potential for lower numbers of eligible students.
While Minnesota’s definitions of disability classifications are largely consistent with federal definitions, 9 of the 13 contain language that may affect the number of students eligible for services. One difference between state and federal disability definitions relates to how the disability affects a student’s life. Federal definitions generally require that a disability affects a student’s educational performance. In contrast, under certain Minnesota definitions, students may qualify for special education if their disabilities affect their development, physical functioning, or other areas of their lives. For example, Minnesota rules say a student qualifies for special education if the student has a visual impairment “accompanied by limitations in sight that interfere with acquiring information or interaction with the environment.”[29] Conversely, the federal definition stipulates only that the visual impairment must “adversely affect a child’s educational performance.”[30]
Federal regulations contain general requirements for evaluating whether a child is eligible to receive special education, such as calling for the use of a variety of assessment tools and strategies.[31] Minnesota rules are much more prescriptive, providing detailed eligibility criteria and evaluation procedures districts must follow. We are unaware of data that have been used to determine whether Minnesota’s disability definitions or evaluation procedures result in more or fewer students qualifying for special education.
Our evaluation focused on students in primary and secondary schools, but as mentioned in Chapter 1, Minnesota has chosen to provide special education to children covered under both parts of the Individuals with Disabilities Education Act. Accordingly, eligible children in Minnesota receive special education services starting at birth.[32]
In certain instances, Minnesota statutes require that students eligible for special education receive more services than required by federal law. For example, federal law requires that IEP teams start planning for students’ transition to adult life when students are age 16.[33] In Minnesota, IEP teams must address students’ needs for transition services in the 9th grade, when students are often younger than 16 years of age.[34]
[Sidebar]
Minnesota requires teachers to start planning for students’ transition out of high school when students are in 9th grade, but the federal threshold for such planning is when students reach age 16.
[End of Sidebar]
Practical Effects of Minnesota Requirements
As mentioned above, past efforts identified which Minnesota statutes and rules exceed federal requirements, but they did not study the practical effects of these extra requirements. To understand how Minnesota-specific special education requirements affect students and schools, we held focus groups with parents of students receiving special education, advocates, special education directors, and school business officials. We selected eight LEAs in different regions of Minnesota for in-depth study. In those LEAs, we interviewed special education directors, business officials, and teachers, and we surveyed parents. We also interviewed education professionals, including superintendents and special education directors, from other LEAs. In addition, we interviewed professionals at disability advocacy organizations.[35]
[Sidebar]
We met with groups of parents, advocates, teachers, directors, and school business officials to discuss their views of the effects certain state requirements have on school districts and students receiving special education.
[End of Sidebar]
Individuals we spoke with described the effects of certain Minnesota requirements on schools and students. They also identified impacts they would expect if state requirements were to change. Overall, we found:
· Educators and advocates have strong and varying opinions about the impacts of special education requirements specific to Minnesota, but comprehensive analyses of the costs and educational benefits of these requirements are not available.
Some Minnesota requirements, such as those requiring additional staff, likely have direct costs. Other requirements could produce costs that are more difficult to quantify. Less tangible costs include higher workloads for special education staff, which can affect their effectiveness as instructors, their job satisfaction, and in turn, districts’ staff retention. They also include the short- and long-term educational impacts of Minnesota-specific requirements on students.
While limited data may be available for analyzing state requirements, information has not been compiled to determine the requirements’ full impact on school districts or students. Cost data have not been weighed against the requirements’ educational and economic benefits. While we think such detailed analyses on state requirements are important, undertaking them went beyond what could be achieved in this evaluation.
RECOMMENDATION
To the extent the Legislature considers potential changes to Minnesota’s special education requirements, it should direct the Minnesota Department of Education to initiate detailed, independent analyses of the economic and educational impacts of any proposed changes.
[Sidebar]
To make informed decisions on changing state special education laws, legislators need independent analyses of the potential changes’ likely effects.
[End of Sidebar]
To decide whether to change special education requirements, the Legislature needs reliable and independent analyses of the potential changes’ likely effects. Such analyses are necessary to quantify and understand cost or time savings, as well as educational and economic impacts on students that could result from proposed changes. For instance, a proposed change to Minnesota’s statute requiring teachers to begin to plan, starting in 9th grade, for the transition of students to postschool activities, would benefit from an analysis of effects such a change might have. It would be important to analyze effects on both students and school districts. The analysis would include likely effects on student achievement of IEP goals as well as on economic impacts, such as finding and retaining employment or living independently after leaving special education. It would also include likely effects on the workloads of teachers who write transition plans and the community interagency transition committees with whom they are required to work.
As we envision it, producing useful analyses on the effects of proposed changes would involve three steps. The first is determining which potential changes to special education laws should be considered. This would be the Legislature’s prerogative. The second step is directing MDE to initiate detailed analyses of the likely effects of the proposed changes. Although this could be done in several ways, we suggest contracting for the work with an independent third party. MDE staff resources would be needed to initiate the process, and funds would be required to conduct the analyses. The third step is reporting the detailed analyses in ways that allow the Legislature to make informed decisions that balance student outcomes with time or cost efficiencies to be gained.
We next turn to the impacts, expressed by individuals we interviewed, of certain special education requirements specific to Minnesota. We also describe the effects these individuals said they would expect if the Legislature were to change these requirements. We divided their comments into two groups: one on responsibilities for LEA staff and a second on student outcomes.
Additional Responsibilities
Some of the stakeholders we spoke with said that certain special education requirements specific to Minnesota increase teachers’ and administrators’ workloads. In this section, we discuss two responsibilities in more depth: increased paperwork and participation in committees. These responsibilities may not result in substantial direct costs to the LEAs, but by adding to teachers’ and administrators’ workload, they may affect the amount of time teachers spend on instruction and class preparation, as well as job satisfaction.
Increased Paperwork
As mentioned earlier in this chapter, teachers and administrators are required to complete a significant amount of paperwork to meet special education requirements. Educators noted that much of the paperwork burden is required by federal law but several said the length of required documents, such as IEPs, evaluations, and prior written notices, has greatly increased, although the federal requirements themselves have not changed recently. According to one teacher, IEPs were typically four pages long when she started teaching 22 years ago. Now, she said, they are four or five times that length and so cumbersome they can be difficult for parents to understand. A special education director said evaluations used to be 3 or 4 pages but now are 11. Several educators noted the evaluation reports are redundant, and information found in different parts of the report is duplicative. For instance, one teacher said the student’s performance information is repeated three times: after the description of specific tests, at the bottom of each page, and at the end of the report in a comprehensive summary.
In addition to the paperwork requirements noted above, special education directors said the total special education system document required by Minnesota rules contributes to their workload.[36] Several special education directors agreed the document takes a lot of time to complete and does not affect services provided to students. One director said these documents are very lengthy and take a lot of resources to complete. He demonstrated this point by presenting the physical document, which was contained in two binders, each approximately five inches thick.
Several educators noted potential conflicts with parents or the possibility of litigation as a driving force behind the level of documentation required in special education. Some said increased documentation is due to the level of detail necessary during the compliance monitoring process supervised by MDE. The length of federally required documents is also most likely affected by Minnesota-specific content requirements for these documents, as described earlier in this chapter.
Short-Term Objectives
Educators indicated that state requirements for IEP content increase the paperwork burden. We found that:
· Some educators said Minnesota’s requirement for short-term objectives in individualized education programs was unnecessary; other educators and advocates said that short-term objectives were important.
Certain educators told us the requirement for short-term objectives has negative impacts. Some said short-term objectives lead to unnecessary busy work that increases their paperwork burden. One teacher said when a student has four or five long-term goals with at least two short-term objectives for each, it equates to a lot of writing that does not necessarily help the students. In addition, some educators said short-term objectives limit teachers’ ability to adjust teaching techniques as they learn which strategies work most effectively for individual students. One special education director said holding an extra IEP team meeting to change objectives can take away from instructional time with students.
Several educators said there would be no major impact if short-term objectives were no longer required. One special education director said teachers would still have to plan how to help students achieve their goals and explain lesson plans to parents, but the teachers could do so in a format that works for them, rather than in the IEP.
[Sidebar]
Parents and some teachers told us the short-term objectives in IEPs help describe how students receiving special education will meet their goals. Other educators said these objectives have little effect.
[End of Sidebar]
Other educators, however, thought short-term objectives had a positive impact. Many educators saw value in short-term objectives as a tool to facilitate lesson planning, data collection, and progress reporting. One teacher said short-term objectives help her break down how to help the student achieve a goal. A special education director said writing short-term objectives and then tracking progress on them give the teachers objective data on which to base students’ progress reports. Some teachers expressed concern over their ability to measure progress towards the goal if short-term objectives were not required.
Advocates strongly expressed their support for short-term objectives in IEPs. In their opinion, these objectives provide measurable data points in IEPs and help parents understand how schools will address and report on annual goals. Some advocates said without short-term objectives, it would be difficult to see progress when long-term goals are not met. Others said short-term objectives are important tools for tailoring IEPs to meet students’ individual needs.
Time Necessary to Meet Paperwork Requirements
Because of the federal and state paperwork requirements described above:
· Educators reported the paperwork burden for special education teachers is significant, but some also noted its usefulness.
Although neither MDE nor the LEAs we visited had undertaken formal time studies to determine the extent of time spent on paperwork, several educators said they dedicate significant time outside the regular workday to complete all of the required paperwork. As an example, one teacher said she had recorded her time to write evaluations for four students; she tallied having worked eight out of nine weekends (for a total of 28.5 extra weekend hours) and 63 extra hours during the intervening weeks to complete the evaluations. As another example, a teacher said 95 percent of his paperwork burden is completed outside his normal work day. This educator went on to say that both general and special education teachers work beyond the hours in a regular school day. He said, however, that special education teachers must do so more because they must complete both academic paperwork and compliance paperwork required specifically and only for special education.
[Sidebar]
Certain teachers said the paperwork requirements for special education are necessary for accountability to students and parents.
[End of Sidebar]
At the same time, some educators acknowledged that paperwork is a necessary component of their jobs. As such, some teachers viewed it as a way to keep organized and be accountable to parents and students. It was only as these teachers’ caseloads grew or they had to meet several deadlines at once that the paperwork became burdensome.
Strategies to Reduce the Paperwork Burden
MDE is aware of the special education paperwork burden and has taken steps to alleviate it. In September 2012, MDE distributed a template that allowed special education directors to substantially reduce time spent developing and revising their total special education system documents. In addition, the Governor’s budget submitted in 2013 includes a proposal for MDE to develop electronic forms for school districts’ documentation of compliance with federal requirements. The department proposes to develop forms that are readily available online, current, and changeable; they would be available for LEAs to use without charge. These forms are intended to allow LEAs to report only the minimum information necessary to meet requirements.
Individual school districts have also taken steps to relieve special education teachers’ paperwork burden. Minnesota statutes allow partial reimbursement for salaries of clerical staff and paraprofessionals that assist teachers with paperwork and make arrangements related to special education compliance requirements.[37] Some LEAs have taken advantage of this, hiring clerical support or paraprofessionals to assist with scheduling meetings, filing, and other clerical duties. Other LEAs use teams to evaluate students for special education eligibility so that this extra duty does not fall on classroom teachers. Some LEAs hire substitute teachers on an as-needed basis to allow special education teachers time to complete paperwork.
We found that:
· Although individual LEAs have taken some steps to relieve paperwork for special education teachers, little evidence exists to document their impact.
Attempts to reduce special education teachers’ paperwork burden have not been systematically studied by LEAs we visited. At the same time, some educators said the various supports available in their LEAs had a positive impact. Some educators said the evaluation teams were helpful, as they remove testing responsibilities and evaluation paperwork from classroom teachers’ workload while keeping all paperwork in the hands of trained professionals. One teacher said clerical assistance was tremendously helpful in making phone calls to set up meetings. Although some educators told us that allowing nonteaching staff to complete certain clerical duties can produce time savings, others we interviewed emphasized the importance of having teachers themselves write key documents, such as IEPs.
RECOMMENDATION
The Minnesota Department of Education should continue its efforts to streamline paperwork required in special education and also evaluate the effectiveness of districts’ paperwork reduction strategies to encourage additional efficiencies.
Educators have called for legislative changes in the past in an effort to alleviate the paperwork burden they believe is exacerbated by certain special education requirements specific to Minnesota. Legislators, MDE, educators, and advocates have had a hard time agreeing on changes, which has made it difficult to amend or repeal special education statutes and rules. Several advocates we spoke with said they did not want to see any changes to Minnesota special education requirements. The issue of special education paperwork has been debated for years in Minnesota, and paperwork reduction through legislation may not be the most viable option.
[Sidebar]
The Minnesota Department of Education should work with school districts to identify strategies for reducing paperwork and then evaluate the potential for their broader use.
[End of Sidebar]
We suggest MDE enlist LEAs in identifying strategies that effectively decrease the amount of time teachers spend on paperwork, evaluating whether these strategies are cost-effective, and determining whether they can be used by other LEAs. MDE should report which strategies work well under certain circumstances. LEAs can then refer to the results of these evaluations to determine which paperwork-reduction strategies may benefit their particular LEA, given available staff and resources. The type of evaluation we suggest would require time and personnel. However, if the evaluations can demonstrate that certain paperwork-reduction strategies are cost-effective, promoting these practices could have a positive effect statewide. The ultimate goal is to reduce the special education paperwork burden without undermining the purpose of the documentation and the integrity of special education requirements.
Responsibilities for Required Committees
As previously mentioned, Minnesota statutes require that LEA staff participate in several committees that are not required by federal law, including community transition interagency committees.
· Some educators told us that the lack of funding and limited participation by county agencies diminishes the impacts of community transition interagency committees.
A number of educators and advocates thought the transition committees had minimal impact. While some educators and advocates believed the idea of bringing different agencies together to discuss transition planning was positive, some stakeholders noted the committees are currently not very effective. One advocate said, “I think sometimes some really good ideas come out but they just…don’t have the authority…the budgeting or the means to sometimes put them in place.” One special education director said it is hard to get people to attend committee meetings when there is no specific goal or funding attached to the committee. Another director said she is not sure of the specific purpose of the committee and what it hopes to accomplish to support transitioning students. A number of educators and advocates had never heard of the committees.
At the same time, some educators and advocates had positive things to say about community transition interagency committees. For example, one teacher noted the committees provide an important venue for teachers to learn about transition resources in the community and enables those teachers to disseminate that information to their students and other school staff. An advocate said the committee in her county is very effective; it allows schools and the county to coordinate on the provision of more comprehensive services.
[Sidebar]
Educators and advocates told us that state-required committees were effective in some school districts but not others.
[End of Sidebar]
Many educators we spoke with predicted students would not be affected if community transition interagency committees were no longer mandated, but some advocates felt otherwise. One special education director noted schools are still obligated to bring in outside providers for individual students’ transition planning. Some advocates worried that, with the absence of a requirement, the already low level of agency interaction would cease altogether, and agencies would not sufficiently coordinate on transition issues. One advocate said, “There’s a need for home/school/community interagency coordination…and without the CTIC [community transition interagency committee] there wouldn’t be a requirement for them to have agreements between each other to cooperate.…”
Many educators also pointed to the requirement for parent advisory councils as challenging to implement. Several educators said they have difficulty finding parents to participate in the committees, even when they offer incentives such as stipends, reimbursement for gas, babysitting, and refreshments at meetings. This is particularly true in rural areas where parents have to travel long distances and in small districts, according to some educators. In addition, one special education director said that like the transition committees, parent advisory councils do not have guidance as to what they should accomplish, nor do they have funding to support them.
Conversely, some advocates said parent advisory councils are essential for offering parents an opportunity to participate at the district level. At the same time, one advocate noted the councils could benefit from legislation that strengthens meeting requirements, and another alluded to a lack of direction for the committees saying, “We go, we play, we’re not sure why.”
Student Outcomes
A second group of requirements we studied is focused on student outcomes. Although educators said some requirements are burdensome, and advocates said certain requirements are not effective in their current form, the people we spoke with generally agreed that many of the requirements specific to Minnesota have positive effects for students.
· Many educators and advocates we interviewed agreed that certain Minnesota statutes and rules pertaining to special education provide important protection for students and increase the quality of special education services.
The following sections describe positive effects identified by stakeholders resulting from requirements for (1) IEP team meetings after students receiving special education have been suspended a specific number of days and (2) limited teacher caseloads. Although these requirements have impacts on special education teachers and administrators’ workloads, as well as LEA finances, educators and advocates we spoke with identified positive impacts stemming from them.
Fewer Suspensions
Minnesota statutes require that IEP teams meet after students receiving special education have been suspended for five consecutive or ten cumulative school days. [38]
· Educators and advocates we interviewed said requirements for IEP team meetings following a set number of days of suspension can reduce suspensions and encourage alternate resolutions to behavioral issues.
While several educators noted suspension of students receiving special education was not common in their districts, they felt the requirement for IEP team meetings is generally positive. Advocates agreed. Educators said the requirement for IEP team meetings can act as a deterrent to suspension, as some administrators take the requirement into account before suspending students receiving special education. One teacher said the threat of a meeting forces schools to use accommodations they might not otherwise use. Another teacher reasoned that when a student is suspended often enough to trigger the required meeting, the current IEP and behavior plan are obviously not meeting the student’s needs, making an IEP team meeting a good idea.
[Sidebar]
The knowledge that an IEP team will be required to meet if a student receiving special education is repeatedly suspended can act as a deterrent to suspensions.
[End of Sidebar]
Both educators and advocates believed the requirement forces schools to actively address student behaviors. Advocates noted it can force districts to perform functional behavioral assessments or develop behavioral intervention plans for students who do not yet have them. [39] Some educators said it is more expensive to effectively address student behaviors because doing so takes a lot of training and time to appropriately apply behavior management techniques. They said, however, that in terms of student outcomes, the techniques are well worth the investment.
Several educators and advocates believed schools would suspend students more frequently if the requirement for IEP team meetings were not in place. In addition, some advocates said the rule is not stringent enough and IEP teams should meet sooner. One advocate said if IEP teams met after the first incident, the teams would have an opportunity to redirect students in an appropriate way and extinguish the problematic behavior, instead of allowing the student to flounder.
Limited Teacher Caseloads
As explained earlier in this chapter, Minnesota rules limit the number of students that may be assigned to a teacher when those students spend more than half of their school day receiving special instruction.
· Several educators and advocates told us caseload limits are important, but they believe current rules are flawed.
[Sidebar]
Minnesota’s limits on special education teachers’ caseloads do not apply when students receiving special education spend the majority of their time in general education classrooms.
[End of Sidebar]
Several educators said caseload limits are necessary and act as protection against administrators who may otherwise try to overload certain special education teachers. One special education director said while she would like caseload limits left to her professional judgment, she realizes not every superintendent and school board would support directors’ staffing decisions. Nevertheless, educators noted a shortcoming of the current caseload limits is that they do not apply to students who spend the majority of their time in general education classrooms. Some educators said certain LEAs place higher numbers of students under the responsibility of teachers whose caseloads are not restricted in rule. For instance, one teacher told us, while working in a previous district, she managed 26 students receiving special education who spent most of their time in general classrooms. Another teacher pointed out that students with less severe disabilities who spend most of their school day in the general classroom (for whom teacher caseloads are not regulated) still have academic and social needs that can require as much attention as more severely disabled students (for whom teacher caseloads are regulated).
Caseload rules do not take into account current classroom conditions, and a simple headcount does not necessarily indicate the size of teachers’ workloads. Some educators said students have more needs than they did in the past. Several advocates agreed, adding it may be better to help manage teachers’ workload, not their caseload. One advocate suggested it may be helpful to perform a detailed workload analysis to understand how special education teachers spend their time. In addition, some educators pointed out the caseload rules take into account up to two paraprofessionals when setting limits, but in reality many classrooms now have more. Other educators believed it was appropriate to limit the consideration of paraprofessionals when setting caseload limits. One teacher would like caseload limits to specify that licensed teachers can be responsible for a certain number of students, rather than just a staff to student ratio. She said teachers are responsible for planning the lessons and doing all of the paperwork, while the paraprofessional just assists in implementing teachers’ plans.
Outdated Administrative Rules
Some administrative rules pertaining to special education are outdated. MDE does not have general rulemaking authority and can therefore proceed with rulemaking only under specific authority. One MDE official told us, as a result, administrative rules for special education have not changed substantially since the 1990s, whereas federal law and state statutes have undergone revision. Certain rules contain references to Minnesota statutes that have been repealed or incorrect federal legal references. In addition, we found that:
· Several of Minnesota’s administrative rules pertaining to special education contain information that is inconsistent with Minnesota statutes.
While it is clear that Minnesota requires schools to plan for and provide transition services earlier than the federally mandated age 16, state rules are inconsistent and differ from statutes. Minnesota statutes state transition planning shall begin during 9th grade.[40] Meanwhile, one rule states transition planning must begin at age 14 while another says planning shall begin at 9th grade or age 14, whichever comes first. [41]
[Sidebar]
While state statutes require teachers to begin planning for students’ transition from high school when those students are in 9th grade, one state rule requires it at age 14 and another at age 14 or 9th grade, whichever comes first.
[End of Sidebar]
Minnesota rules pertaining to parental consent to evaluate students for special education eligibility also differ from statutes. According to Minnesota statutes, districts may not override the written refusal of a parent to consent to an initial evaluation or reevaluation.[42] Minnesota rules, however, state if parents refuse consent for their child’s initial evaluation, the district may continue to pursue an evaluation using mediation and due process procedures.[43]
Minnesota statutes regarding due process hearings were significantly revised in 2009, but corresponding rules were not subsequently revised to reflect these changes. This has led to discrepancies. In one case, the rules state the district bears the burden of proof during a due process hearing, except when a parent wants the district to pay for a placement in a private school, while statutes state the party seeking relief bears the burden of proof.[44]
School district obligations are not ambiguous because statutes take precedence over rules. Differences such as those indicated above, however, can cause confusion among school staff, parents, and the general public, who may refer to rules without realizing they are no longer up to date.
RECOMMENDATION
The Minnesota Department of Education should update its administrative rules regarding special education for consistency with Minnesota statutes.
Minnesota statutes state the rules governing special education should support schools by resulting in one or more specified outcomes, such as increasing time available to teachers for educating students and providing greater focus for state and local resources.[45] It is possible that Minnesota rules could benefit from a comprehensive revision that takes these outcomes into consideration. We acknowledge that a comprehensive revision would be politically challenging. At a minimum, we believe it is necessary to revise rules for consistency with Minnesota statutes.
[Sidebar]
Minnesota’s administrative rules governing special education could benefit from a comprehensive updating.
[End of Sidebar]
To implement our recommendation to update special education rules, MDE would have to overcome some obstacles. As mentioned above, MDE does not have general rulemaking authority, and therefore may only repeal or amend rules under specific circumstances. The department may amend certain rules in order to “incorporate specific changes set forth in applicable statutes when no interpretation of law is required” through a provision exempt from regular rulemaking requirements.[46] Under this provision, the department may make technical changes, such as changing numbers to conform to statutory language. To use this exemption, MDE would need to present the Office of Administrative Hearings with adequate justification that such changes are small enough that the regular rulemaking process is unnecessary or impracticable. As another option, MDE may use a different process that is exempt from regular rulemaking requirements to repeal certain obsolete rules.[47] This process pertains to rules identified as obsolete in an annual report the department must submit to the Legislative Coordinating Commission and others.[48] For the special education rules that are inconsistent with statutes, it is unclear whether MDE would need to request legislative authority to amend rules under either circumstance described above. In cases where MDE needs to make substantive changes to rules and must use the regular rulemaking process, the department would need to request specific legislative authority to proceed. MDE is in the best position to decide under what authority to proceed with necessary changes. We believe achieving consistency between Minnesota’s special education statutes and rules warrants the effort.
[1] We restricted our review to (1) the Individuals with Disabilities Education Act, codified in 20 U.S. Code, secs. 1400-1419 (2004) and (2) the federal regulations contained in 34 CFR sec. 300 (2006). We did not include the act’s sections 1431-1444 in our review, as the scope of our evaluation is focused on students in kindergarten through 12th grade, and those sections pertain to infants and toddlers. In addition, we did not include sections 1450-1482, as they pertain to competitive grants, cooperative agreements, and contracts for activities to improve education for students with disabilities.
[2] Minnesota Statutes 2012, 125A.0942.
[3] Our analysis focused on students in kindergarten through 12th grade, and for that reason we excluded Minnesota statutes governing the provision of early childhood services: Minnesota Statutes 2012, 125A.259 to 125A.48. We also excluded Minnesota Statutes 2012, 125A.61 to 125A.73, which pertain to the state academies for the deaf and blind. We did not include the academies in our research because they serve only a small share of students receiving special education.
[4] In addition to analyzing Minnesota Statutes 2012, chapter 125A, which governs the provision of special education in public schools in the state, we analyzed statutes in chapters 120 through 129B that contained requirements for special education.
[5] We excluded two rules in Minnesota Rules 2007, chapter 3525, from our analysis because they pertained to early childhood education.
[6] Minnesota Rules 2008, 3525.1341, subp. 2.
[7] The total special education system is a document MDE monitors to ensure LEAs implement pertinent requirements related to the Individuals with Disabilities Education Act.
[8] Minnesota Rules 2011, 3525.1100, subp. 2C.
[9] Minnesota Statutes 2012, 125A.091, subd. 3a; and Minnesota Rules 2007, 3525.2710, subp. 6.
[10] Minnesota Rules 2007, 3525.2810, subp. 1A(2) and (10).
[11] Minnesota Statutes 2012, 125A.0942, subd. 1. The term “restrictive procedures” refers to the use of physical holding or seclusion of a student in an emergency situation. Physical holding means physical intervention intended to hold a child immobile or limit a child's movement. Seclusion is confining a child alone in a room from which egress is barred.
[12] Minnesota Rules 2007, 3525.2710, subp. 4F; and Minnesota Statutes 2012, 125A.0942, subd. 3(7)(iv). A functional behavioral assessment is a process for gathering information to maximize the effectiveness of behavioral interventions. The assessment includes a description of problem behaviors and the identification of events, times, and situations that predict the occurrence and nonoccurrence of the behavior.
[13] Minnesota Rules 2011, 3525.2900, subp. 4B. Transition services include instruction and community experiences designed to improve a student’s academic and functional achievement and facilitate the student’s movement from school to adult life.
[14] Minnesota Statutes 2012, 125A.22 (3) and (6).
[15] Minnesota Rules 2007, 3525.2405, subp. 1.
[16] Minnesota Rules 2007, 3525.2340, subp. 4A and B.
[17] Minnesota rules account for up to two program support assistants with certain caseload limits. Percentage of time receiving direct instruction is divided into two categories: (1) students who spend at least 50 percent, but less than 100 percent, of the school day receiving direct special instruction; and (2) students who spend the entire school day receiving direct special instruction.
[18] Minnesota Statutes 2012, 125A.091, subd. 7.
[19] Ibid., subd. 11.
[20] Ibid., subd. 10.
[21] Minnesota Statutes 2012, 125A.091, subd. 15.
[22] Minnesota Statutes 2012, 125A.0942, subd. 2(c).
[23] Minnesota Statutes 2012, 121A.67, subd. 2.
[24] Minnesota Statutes 2012, 121A.43(a).
[25] Minnesota Rules 2007, 3525.3700, subp. 1a A, D, and E; and Minnesota Statutes 2012, 125A.091, subd. 15.
[26] Minnesota Rules 2007, 3525.3900, subp. 5, and 3525.3600.
[27] Minnesota Rules 2007, 3525.2325, subps. 2 and 3.
[28] Minnesota Rules 2007, 3525.2550, subp. 2; and 34 CFR sec. 300.301(c)(1)(i) (2006).
[29] Minnesota Rules 2007, 3525.1345, subp. 1.
[30] 34 CFR sec. 300.8 (c)(13) (2007).
[31] 34 CFR sec. 300.304 (b)(1) (2006).
[32] Minnesota Statutes 2012, 125A.03 (b).
[33] 20 U.S. Code, sec. 1414(d)(1)(A)(i)(VIII) (2004).
[34] Minnesota Statutes 2012, 125A.08 (b)(1).
[35] Going forward, we use the term “advocates” to refer collectively to parents and advocates and the term “educators” to refer to teachers, directors, and school business officials.
[36] As noted previously in this chapter, the total special education system is a document that contains LEAs’ plans for providing special education. MDE monitors the document to ensure LEAs implement federal requirements.
[37] Minnesota Statutes 2012, 125A.76, subd. 1(b).
[38] Minnesota Statutes 2012, 121A.43 (a).
[39] Behavioral intervention plans are positive, proactive, individualized approaches to support students experiencing behavioral difficulties in school, home, and community environments. They rely upon data collected during functional behavioral assessments (defined previously in this chapter), are developed by IEP teams, and become an integral part of students’ IEPs.
[40] Minnesota Statutes 2012, 125A.08 (b)(1).
[41] Minnesota Rules 2007, 3525.2810, subp. 1A(7); and Minnesota Rules 2011, 3525.2900, subp. 4.
[42] Minnesota Statutes 2012, 125A.091, subd. 5.
[43] Minnesota Rules 2007, 3525.2710, subp. 1.
[44] Minnesota Statutes 2012, 125A.091, subd. 16; and Minnesota Rules 2007, 3525.3900, subp. 4F.
[45] Minnesota Statutes 2012, 125A.07 (b)(1) and (6).
[46] Minnesota Statutes 2012, 14.388, subd. 1(3).
[47] Minnesota Statutes 2012, 14.3895.
[48] Minnesota Statutes 2012, 14.05, subd. 5.
List of Recommendations
- The Legislature should consider options to reduce certain school districts’ substantial reliance on general education funding to pay for special education expenses.
- The Legislature should consider modifying laws that require school districts to pay special education costs of students who choose to enroll outside their resident districts.
- The Minnesota Department of Education should evaluate its monitoring process to identify ways to improve special education teachers’ understanding of compliance requirements.
- To the extent the Legislature considers potential changes to Minnesota’s special education requirements, it should direct the Minnesota Department of Education to initiate detailed, independent analyses of the economic and educational impacts of any proposed changes.
- The Minnesota Department of Education should continue its efforts to streamline paperwork required in special education and also evaluate the effectiveness of districts’ paperwork reduction strategies to encourage additional efficiencies.
- The Minnesota Department of Education should update its administrative rules regarding special education for consistency with Minnesota statutes.
Case Studies of Local Education Agencies
Appendix a
In this appendix, we present background information on eight local education agencies (LEAs) around Minnesota that we visited as part of this evaluation of special education. We met with LEA representatives to learn more about special education services available for their students, as well as to better understand their perspectives on various special education issues.
We selected eight LEAs for in-depth study, and Exhibit A.1 illustrates the location of each agency. Our selection was based on multiple factors, including type of LEA, geographic location, and special education enrollment size. In advance of visiting the LEAs, we collected background information, such as numbers of students receiving special education, types of special education programs available in the district, and the most recent results from each LEA’s compliance monitoring conducted by the Minnesota Department of Education. After collecting data on the LEAs, we visited each site and interviewed: special education directors, school business officials, and small groups of teachers. We surveyed a small number of parents from each of the eight LEAs. We also analyzed information in the individualized education programs from a randomly selected set of students receiving special education in each LEA.
Summary information on the LEAs we visited follows. The information includes background on the LEA, a brief description of its special education services, and key information from our interviews there.
Exhibit A.1: Local Education Agencies Selected as Case Studies, 2012
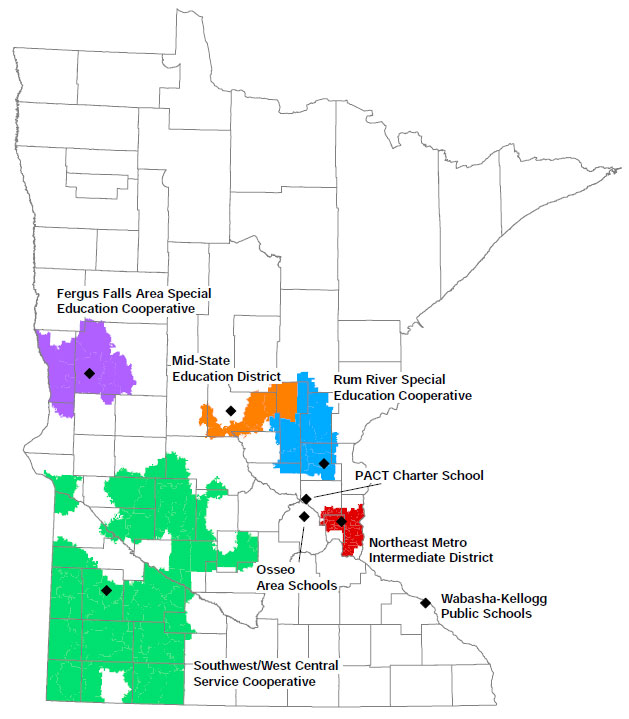
[TEXT REPRESENTATION OF GRAPHIC LOCATIONS]
Fergus Falls Area Special Education Cooperative
Mid-State Education District
Rum River Special Education Cooperative
PACT Charter School
Northeast Metro Intermediate District
Osseo Area Schools
Wabasha-Kellog Public Schools
Southwest/West Central Service Cooperative
NOTES: Each marker represents a local education agency (LEA) visited by the Office of the Legislative Auditor during the fall of 2012. The location of the marker represents the city in which the LEA’s main office or address is located. Five of the eight LEAs we visited were cooperative entities with multiple member school districts. The shaded portions of the map represent the area of each LEA’s member districts.
SOURCE: Office of the Legislative Auditor.
Fergus Falls area Special education Cooperative
Background Information
The Fergus Falls Special Education Cooperative has eight member school districts located in and near the city of Fergus Falls, including districts in Grant, Otter Tail, and Wilkin counties in northwestern Minnesota. The cooperative was established in 1976 for the purpose of sharing special education services among its member districts. It offers services and specialists in special education that its member districts could not afford on their own.
In the 2010-2011 school year, the cooperative had 50 students enrolled in special education, which accounted for 86 percent of its enrolled students. The cooperative also serves additional students located within its member districts by employing specialists, such as a teacher of the blind and visually impaired and a speech pathologist, who travel to individual districts and spend time with students in need of specific services.
Special Education Services
The Fergus Falls Special Education Cooperative offers day treatment programs for elementary and middle school students who spend at least 60 percent of their school day outside the general classroom. Students in these programs have emotional behavioral disorders, and they receive mental health services along with educational services.
In addition to the cooperative’s own self-contained classrooms for its day treatment program, the cooperative hires or contracts for teachers licensed in other disability categories. The cooperative has teachers on staff to work with students who are (1) deaf or hard of hearing or (2) blind or visually impaired; it also has occupational therapists, physical therapists, speech pathologists, and school psychologists. When member school districts need these services, the cooperative provides a share of the appropriate staff person’s time for the service. In addition, the cooperative has teachers whose time is provided on a contract basis to a private residential treatment facility designed for high school students needing an alternative school setting.
Key Information from Interviews
The cooperative has arrangements to help manage teachers’ time burdens and prevent legal problems. One is that evaluations of children (to determine eligibility for special education) are begun in districts outside the cooperative but completed by the cooperative’s staff; this frees the cooperative’s classroom teachers from much of the initial administrative work involved with compiling assessments of the student. A second is the cooperative’s identification of cases where there is a risk of future service problems; once identified, those cases are the focus of staff discussions about actions they can take to help avert potential problems. In addition, all of the cooperative’s teaching staff receive 3.5 days of training each year to learn about legal requirements in special education. The intent is to keep teachers knowledgeable about the many legal requirements tied to special education so that they can meet requirements and avoid disputes.
Hiring teachers with sufficient special education licensure is a concern in the cooperative in part because of the cooperative’s location near the border with North Dakota. One concern was that the Dakotas do not have teacher licensure requirements for individual disability categories, as Minnesota does, making it difficult for the cooperative to readily hire applicants from across the state border. Another concern was that the cooperative’s distance from the Twin Cities puts it at a disadvantage in terms of access to training opportunities.
MID-state EDUCATION DISTRICT
Background Information
The Mid-State Education District is headquartered in Little Falls and provides special education services to five member districts in Morrison and Mille Lacs counties: Onamia, Royalton, Pierz, Swanville, and Upsala. Member districts purchase from the education district the special education services their students need. By law, education districts may be established by a group of school districts to coordinate educational services and programs, such as (but not limited to) those for students with special needs.
The Mid-State Education District had 58 students enrolled in the 2010-2011 school year, and all students enrolled received special education. However, this number includes only those students who attended the education district’s own facilities for students with high needs and did not attend classes in their home district. The education district’s specialists, in areas such as autism and speech therapy, served many additional students, as the specialists traveled among member districts to work with individual students.
Special Education Services
The Mid-State Education District operates three programs for students receiving special education whose needs require a high level of services in facilities separate from the students’ home schools (known as instructional setting four). Two programs, one elementary and one at the high school level, are for students with emotional or mental health needs; the third is a program for 18- to 21-year olds to learn skills for transitioning to adulthood. The education district also operates two “Success” programs located within member districts, one at the elementary level and the other for secondary grades. These programs are targeted at students who are low functioning and medically fragile, who require services outside the general classroom for more than 60 percent of the day, but who are served in a traditional school (instructional setting three). As mentioned, Mid-State Education District also offers to its member districts the services of many specialists who are not needed full time in any single one of the five member districts. Specialists include those in the areas of: deaf or hard of hearing, blind or visual impairments, physical therapy, assistive technology support, autism, audiology, developmental adaptive physical education, speech, school psychologist services, and occupational therapy.
Key Information from Interviews
Mid-State Education District teachers and administrators described taking extra steps to maintain good relationships with parents of students receiving special education. They hold meetings in the evenings to accommodate parents’ work schedules. They communicate frequently with parents, both to establish good working relationships and to head off potential problems before they might otherwise arise. When evaluating children to determine their eligibility, teachers may test a child more in depth than is required to make certain nothing is missed. The district has also reevaluated students more frequently than required when parents requested it.
Mid-State Education District representatives voiced concerns about special education costs that are not reimbursed by the state, such as for classroom facility rental. It is of particular concern because the education district does not have authority to tap additional revenue sources available to independent school districts, such as raising revenues through a lease levy or operating levy referendum or taking out loans. Nor can it assess fees when nonmember districts place a student in a Mid-State program.
Norhteast Metro intermediate school district 916
Background Information
Northeast Metro 916 is one of three intermediate school districts in the metropolitan area that provides cooperative special education, vocational education, and other services authorized by law to member school districts. The central office is located in White Bear Lake, and Northeast Metro 916 serves students in locations throughout its 10 member districts in Washington, Anoka, and Ramsey counties. Its programs are designed to serve students with high needs who cannot be successfully educated in their home districts.
Northeast Metro 916 enrolled 590 students in special education in its own facilities during the 2010-2011 school year, representing 8 percent of the district’s student population. The composition of its highly mobile student body changes greatly throughout the year. In addition to providing special education to students in its own facilities, Northeast Metro 916 provides staff that serve students in member districts.
Special Education Services
The majority of Northeast Metro 916’s programs are setting-four programs, meaning separate day facilities designed specifically to serve students receiving special education outside the traditional school. These setting-four programs serve students with significant behaviors, primarily with severe emotional or behavioral disorders and autism spectrum disorders. The district has four programs for primary school students, five programs for secondary school students, and two programs specifically for students transitioning to adult life (18 to 21 years of age). Some programs offer highly specialized services for students with multiple disabilities; neurobiological disorders, such as Tourette syndrome; and other low-incidence disabilities.
In addition to setting-four special education programs, Northeast Metro 916 offers several other services to member districts. Member districts can contract with Northeast Metro 916 staff to provide related services within their districts, such as occupational therapy, psychology services, and interpreters for the deaf and hard of hearing. Northeast Metro 916 also has a student assessment center and an assistive technology library.
Key Information from Interviews
Northeast Metro 916 offers substantial support to its special education teachers. The district has an intake coordinator that ensures all appropriate documentation is in place when a student enters a program. A set of teachers on special assignment review students’ paperwork and assist with due process issues, and each building in the district has a due process clerk that sets up meetings and keeps track of due dates. Teachers still have significant paperwork duties, partly because the severity of students’ disabilities requires that teachers monitor progress intensively and communicate frequently with parents. Northeast Metro 916 occasionally hires substitute teachers to give teachers time to complete required paperwork.
As member districts improve their ability to serve many students with disabilities within their own schools, they need only to refer the most challenging students to Northeast Metro 916. Consequently, the students Northeast Metro 916 serves increasingly exhibit aggressive behaviors and mental illness. Staff reported it is not unusual for ambulances to be called because students attempted to hurt themselves or others. Workers’ compensation rates for the district have tripled in the last decade due to the number of injuries sustained by staff. In addition, there has been a greater need for mental health staff and one-to-one paraprofessionals.
Osseo Area Schools
Background Information
Osseo Area Schools is an independent school district located in the northwest metropolitan area with offices in Maple Grove. It is the fifth-largest district in the state, serving all or parts of Brooklyn Center, Brooklyn Park, Corcoran, Dayton, Hassan, Maple Grove, Osseo, Plymouth, and Rogers. Osseo facilities include 17 elementary schools; 4 junior high schools; 3 high schools; and a handful of specialized sites such as an area learning center, early childhood centers, special programs, and adult education.
During the 2010-2011 school year, 3,026 of Osseo’s 21,960 enrolled K-12 students received special education for at least part of the school year. Students receiving special education represented almost 14 percent of the student population.
Special Education Services
All elementary and secondary schools in Osseo Area Schools offer special education services in instructional setting one (for students who spend most of their time in the general classroom) and setting two (for students who spend no more than 60 percent of their school day outside the general classroom). These are known as “Full Service Special Education,” which reflects a multi-disciplinary team model using teachers licensed in multiple disability areas. Osseo also offers three types of self-contained (setting-three) programs. The “Skills” program focuses on students with significant needs in the area of functional skills, the “Connect” program focuses on students who have significant social-connection skills needs, and the “Strategies” program focuses on students with significant emotional or behavioral skills needs. Most of the junior high and high schools in the district host each of the three types of setting-three programs. Setting-three programs for elementary students are hosted only in particular school buildings. Osseo Area Schools has a setting-four program (“ACHIEVE”), which is a separate school site serving secondary students with emotional, social, and behavioral concerns. Finally, the Osseo Secondary Transition Center serves students age 18 to 21 with transition needs.
Key Information from Interviews
Osseo Area Schools has taken some steps to help special education teachers manage their workloads. Each school site has a paraprofessional who helps with filing, scheduling meetings, sending meeting notices, and updating student data systems. The district also budgets for substitute teachers so that special education teachers can take time off each trimester to catch up on paperwork. Finally, we were told that the district would like to investigate other methods of reducing paperwork, such as having a specific team of teachers conduct all evaluations, which would relieve other teachers of that duty.
An overriding theme from our interviews with Osseo staff was the importance of training, both in general and in relation to special education paperwork requirements. Staff expressed the general opinion that the Minnesota Department of Education’s and the district’s monitoring processes were good ones and that self-monitoring is a useful exercise, allowing districts to identify their own mistakes and target trainings as needed. The district realizes that ongoing training is necessary to build staff competence and, with so many regulations governing special education, it takes more than one training for a teacher to internalize everything he or she is supposed to know. Teachers we interviewed spoke highly of Osseo’s training in general, saying the district does a good job helping teachers keep their licensure current and at making districtwide training relevant for all staff, including special education teachers.
PACT CHARTER SCHOOL
Background Information
The PACT Charter School is located in the city of Ramsey within Anoka County and has been operating since the 1994-1995 school year. Charter schools are public schools governed by parents, teachers, and community members to encourage innovative teaching methods and increase learning opportunities for students; PACT is an acronym for “parents allied with children and teachers.” In the 2010-2011 school year, PACT had 144 students receiving special education, which was about 22 percent of its total enrollment.
Special Education Services
Most of PACT’s students receiving special education are served in PACT’s general education classrooms throughout most or all of the students’ school day. Depending upon individual needs, students may be pulled out of the general classroom for certain periods during the day to work with specialists, such as a speech therapist, in PACT’s special education area. PACT also operates a “Behavior Enhancement for Success and Transition” program, aimed at 7th through 12th graders receiving special education who are not achieving in the general education classroom. These students spend much of their school days in PACT’s special education resource area, but they also participate with their school-age peers in elective classes and on field trips. PACT contracts for services from specialists who provide special education services that are not needed on a full-time basis. The specialists include a physical therapist, occupational therapist, school psychologist, audiologist, and an instructor for the deaf and hard or hearing.
Key Information from Interviews
As a way to help special education teachers manage their workload, PACT Charter School provides substitute teachers when special education teachers need time to complete required paperwork. PACT also hired one special education teacher to focus on administering the academic tests needed to help determine eligibility; to allow time for that work, the teacher was given a lower student caseload. The school’s expectation was that, with this teacher conducting assessments, other special education teachers could concentrate on their classrooms instead of leaving the rooms to test students.
PACT Charter School employees spoke to us of the importance of having sufficient guidance from the Minnesota Department of Education to implement special education laws and rules. They said such guidance would be especially beneficial in understanding criteria for determining whether children are eligible for special education, such as in the category of specific learning disabilities. They also said both teachers and administrators need training on special education’s legal requirements, especially after those requirements have been modified.
rum river Special education cooperative
Background Information
The Rum River Special Education Cooperative provides special education and technical assistance to seven member districts in east central Minnesota. With offices located in Cambridge, it serves the surrounding districts of Braham, Cambridge-Isanti, Isle, Milaca, Mora, Ogilvie, and Princeton. The cooperative helps member districts provide a full range of special education services that could otherwise be difficult for each district to provide individually.
The cooperative enrolls students in only special education, and it served 111 students in its programs during the 2010-2011 school year. In addition, cooperative staff provided education and related services to students receiving special education who attended schools within their home districts.
Special Education Services
Specialized services offered by the Rum River Special Education Cooperative are provided to students primarily in their home districts. Exceptions are two cooperative programs that are separate day facilities designed specifically to serve students receiving special education outside the traditional school (known as instructional setting-four programs). For its member districts, the cooperative offers teachers for students in low-incidence disabilities, such as deaf and hard of hearing and visual impairments; it also offers support with occupational therapy, school psychology, audiology, and other necessary services. The cooperative’s setting-four programs, Rum River North and Rum River South, offer specialized programs for students in elementary and secondary school. Students in these programs have emotional or behavioral disorders, autism spectrum disorders, or developmental cognitive disorders, and all students exhibit challenging behaviors.
Key Information from Interviews
Throughout our interviews with representatives from the Rum River Special Education Cooperative, staff emphasized the importance the cooperative places on complete, correct documentation. Thorough documentation not only protects students’ and parents’ rights, but it also protects the cooperative in cases of litigation and prepares it for the Minnesota Department of Education monitoring process. The cooperative offers training and a detailed manual to help its staff prepare required paperwork correctly and ensure they thoroughly document that each student has received the services laid out in his or her individualized education program. The Rum River Special Education Cooperative also uses online software to manage special education paperwork, such as individualized education programs. By allowing teachers to access students’ documents online, the software facilitates communication between the cooperative’s staff who provide special education in multiple districts and teachers in these districts. The cooperative said it has increasingly consulted with lawyers to ensure its programs are both educationally and legally sound and to protect itself against potential litigation. In addition, staff report they consider disagreements with parents carefully and sometimes comply with parents’ requests rather than confront a possible lawsuit.
Southwest/west central service cooperative
Background Information
Southwest/West Central Service Cooperative is one of ten service cooperatives established in Minnesota statutes to provide its members with programs and services, such as special education, that can be better provided cooperatively than individually. With its central office in Marshall, the Southwest/West Central Service Cooperative covers 18 counties and provides special education services to 48 member school districts. Most of its member school districts are small and rural.
Of the 330 students enrolled in the cooperative’s educational programs during the 2010-2011 school year, 130 received special education. In addition, the cooperative provided direct instruction to students with less common disabilities and other services, such as physical therapy, on a contract basis in its member school districts.
Special Education Services
Many of the Southwest/West Central Service Cooperative’s services are provided through itinerant staff traveling to member districts where services are needed. The cooperative hires staff that are hard to find, such as teachers for less common disabilities. For example, the cooperative employs instructors for students who are deaf or hard of hearing, as well as students with visual impairments. The cooperative also employs staff, including social workers and speech and language pathologists, that its member districts do not need on a full-time basis.
The Southwest/West Central Service Cooperative operates special education programming at four sites. Those sites are the Blue Mound Learning Center, which has a behavior program for students; Belview Learning Center, which has a behavior program and a therapeutic program; Red Rock Ridge, which has a behavior program and a therapeutic program; and Cosmos Learning Center, which has a behavior program and an autism program. In addition, the Red Rock Ridge has an alternative learning center program that provides education to students who are not identified as having a disability. The service cooperative also hires the staff for the Heartland Girls Ranch in Benson, which is a private residential alternative learning center overseen by the Benson School District.
Key Information from Interviews
The Southwest/West Central Service Cooperative’s regional special education directors and coordinators assist member districts in complying with federal and state special education requirements. The cooperative provides training to its member districts to assure that administrators understand what is legally acceptable and compliant with special education laws. The cooperative also provides training on paperwork requirements so teachers and administrators have the most current information to prevent errors when completing their work. Some of the cooperative’s training focuses on strategies to avoid conflict, such as how to run individualized education program meetings in ways to allow team members to feel comfortable and work together effectively.
Because the cooperative provides a wide variety of services to a large number of districts, cooperative staff expressed concerns about a range of issues. They said the complexity and length of paperwork presents a burden to teachers and is often too confusing to be understood by parents. In addition, the cooperative said in recent years it has provided more mental health services for students in member districts. Cooperative staff said counties have decreased their services for mental health, placing a greater financial responsibility on schools.
Wabasha-Kellogg Public Schools
Background Information
Wabasha-Kellogg Public Schools is an independent school district located in southeast Minnesota, near the Wisconsin border. The Wabasha-Kellogg district consists of one high school and one elementary school, both of which share a building with the main district offices in Wabasha, Minnesota.
During the 2010-2011 school year, 98 of Wabasha-Kellogg’s 647 enrolled K-12 students received special education for at least part of the school year. Students receiving special education represented 15 percent of the student population.
Special Education Services
Wabasha-Kellogg employs its own licensed staff to instruct students with disabilities such as specific learning disabilities, speech or language impairments, emotional or behavioral disorders, and developmental cognitive disabilities. The district is a member of the Hiawatha Valley Education District, which provides additional special education services including school psychology, physical therapy, assistive technology, and audiology, among others. The vast majority of Wabasha-Kellogg students receiving special education are served in one of the two least restrictive instructional settings at the school district site.
Key Information from Interviews
Wabasha-Kellogg efforts to reduce paperwork for special education teachers include employing a half-time special education secretary who schedules meetings, sends out meeting notices, and handles some of the paperwork associated with third-party billing. As a member of the Hiawatha Valley Education District, Wabasha-Kellogg receives special education director services through the education district. Wabasha-Kellogg is, however, one of the few education district members to have its own special education coordinator. This coordinator helps teachers comply with special education paperwork requirements.
Each of the groups we interviewed identified special education staffing as a concern for small school districts in general and for Wabasha-Kellogg in particular. Interviewees told us that when districts have small numbers of students receiving special education, there often are not enough students in a given disability category to justify hiring a full-time instructor licensed in that disability area. Ideally, the district would like to hire special education teachers that hold multiple licensures and can teach students with different types of disabilities. When Wabasha-Kellogg has posted job openings, however, there have been few applicants, and the positions have been difficult to fill with qualified special education instructors. To properly staff its special education program, Wabasha-Kellogg has used a number of approaches including co-teaching, requesting variances allowing instructors to teach outside their licensed area, and using consultants from the Hiawatha Valley Education District.
Minnesota Legal Requirements
appendix b
This appendix presents the results of our comparison of federal and state special education requirements. We compared Minnesota’s special education requirements to those specified in the Individuals with Disabilities Education Act, codified in 20 U.S. Code, chapter 33 (2004), and related federal regulations. We focused on the Individuals with Disabilities Education Act because it is the principal federal law governing the provision of special education to eligible students. We did not examine related laws, such as the Rehabilitation Act of 1973 (Section 504) and the Americans with Disabilities Act of 1991, which provide protection to students against discrimination, as well as access to special education for some students who do not qualify under other laws.
We limited our analysis to Minnesota requirements that primarily govern the provision of special education to students in public school districts in kindergarten through 12th grade. We excluded requirements pertaining to infants and toddlers because our evaluation focused on students in primary and secondary school. Therefore, we analyzed Minnesota Statutes 2012, chapter 125A, which governs the provision of special education in public schools in the state, and select statutes in chapters 120 through 129B that contained requirements for special education. We excluded Minnesota Statutes 2012, 125A.259 through 125A.48, which pertain to services for infants and toddlers. Similarly, we excluded 20 U.S. Code, sections 1431-1444 (2004) and corresponding federal regulations from our review because they set out federal requirements for provision of services to infants and toddlers.[1] We also excluded Minnesota Statutes 2012, 125A.61 through 125A.73, which pertain to the state academies for the deaf and blind. We did not include the academies in our research because they serve a very small share of students in special education.
Our comparison focuses on federal and state laws, statutes, regulations and administrative rules. It does not include guidance issued by the Minnesota Department of Education (MDE). Such guidance is intended to help school administrators put rules and statutes into practice but is not mandatory. Examples of guidance are MDE’s training on compliance monitoring, technical assistance manuals, and “Q & A” pages posted on its Web site. The “Q & A” documents explicitly state they are for “helpful, general” information and do not constitute legal advice. Our comparison also excludes case law.
In making our comparison, we determined a Minnesota requirement exceeded a federal one if it went beyond the minimum quantity, degree, or rate of special education services or professional responsibilities required by the federal government. This included cases in which the Individuals with Disabilities Education Act is silent on issues regulated by Minnesota statutes. As an example, statutes governing the use of restrictive procedures have no counterpart in federal requirements and impose professional responsibilities not required by federal law, including staff time for meetings, documentation, and training.
We determined a Minnesota requirement did not exceed federal requirements for several reasons; the statute or rule: (1) referenced or repeated federal requirements; (2) directly implemented federal requirements; (3) did not dictate additional responsibilities for or services from local education agencies, MDE, or others; or (4) in certain cases, created procedures to carry out activities that were not addressed in the Individuals with Disabilities Education Act, but states must practically address. For example, states that choose to provide state special education aid must develop a system for doing so. For that reason, we determined that Minnesota’s statutes and rules that regulate the disbursement of state special education aid do not exceed federal requirements, although they carry financial and workload implications. This is in contrast to statutes and rules, such as those regulating the use of restrictive procedures, without which a state could continue to fund and provide special education.
The Minnesota statutes and rules in the following tables exceed federal legal requirements for special education. We grouped the requirements specific to Minnesota into eight categories. The tables list requirements by each category: (1) documentation, (2) committees, (3) staffing, (4) dispute resolution, (5) meetings, (6) timelines, (7) other miscellaneous professional responsibilities, and (8) student eligibility.
Exhibit B.1: Documentation Requirements Specific to Minnesota, 2012
|
MN Statute or Rule Number |
Subdivision or Subpart |
Description of Minnesota Documentation Requirements |
|
|
|
|
|
Statute |
|
|
|
|
|
|
|
125A.027 |
Subd. 1(b)(4)* |
Members of interagency early intervention committees must use standardized written plans for providing services to children with disabilities. |
|
|
|
|
|
|
Subd. 1(b)(7)* |
Members of interagency early intervention committees must develop transitional plans for young children moving into the interagency intervention service system, which coordinates services for children between the ages of 3 and 21. |
|
|
|
|
|
125A.06 |
(e)* |
Minnesota sets requirements for the content of blind students' IEPs. |
|
|
|
|
|
125A.091 |
Subd. 3a* |
Minnesota specifies content that must be included in prior written notice in addition to federal requirements. |
|
|
|
|
|
|
Subd. 15 |
Hearing officers must create a written, verbatim record of the prehearing conference. Prehearing conferences are not required under federal law. |
|
|
|
|
|
125A.0942 |
Subd. 1* |
Schools that intend to use restrictive procedures must maintain and make publicly accessible a restrictive procedures plan that meets specific guidelines. |
|
|
|
|
|
|
Subd. 3(a)(4)* |
Each time school staff use physical holding or seclusion, the person who implements or oversees the action must document the incident with specific details (description of the incident, why less restrictive measures failed, etc.). |
|
|
|
|
|
|
Subd. 3(a)(6)(ii)* |
Before using a room for seclusion, schools must register the room with the commissioner of education. |
|
|
|
|
|
|
Subd. 3(a)(7)(i), (ii), and (iv)* |
School districts must provide the Minnesota Department of Education (MDE) with lists of staff trained and qualified to use prone restraint, as well as the type of training provided to staff and by whom. Each incident of the use of prone restraints must be reported to the department within five working days on a form provided by the department. |
|
|
|
|
|
|
Subd. 3(a)+ |
MDE must report to the Legislature on the use of prone restraints in schools. |
|
|
|
|
|
|
Subd. 3(b)+ |
MDE must develop a statewide plan to reduce the use of restrictive procedures. |
|
|
|
|
|
|
Subd. 5(b)+ |
The commissioner of education must develop and maintain a list of training programs that satisfy the requirements for staff to be qualified to use restrictive procedures. |
|
|
|
|
|
|
Subd. 5(b)* |
Districts must maintain records of staff who have been trained in the use of restrictive procedures and the organization that conducted the training. |
|
|
|
|
|
125A.21 |
Subd. 2(b) and (c)(1)* |
Districts must provide parents with annual notice of intent to seek reimbursement from medical assistance or Minnesota Care for covered IEP services. Federal regulations only require that consent be obtained at the time insurance is used. |
|
|
|
|
|
125A.22 |
(3)* |
Members of community transition interagency committees must develop a community plan to include mission, goals, objectives, and an implementation plan for students’ transition needs. |
|
|
|
|
|
|
(6)* |
Members of community transition interagency committees must prepare an annual written summary assessing the progress of transition services in the community. |
|
|
|
|
|
125A.515 |
Subd. 5(b)(1) and (2) |
If a student is placed in a Department of Human Services or Department of Corrections facility, the providing agency must conduct an IEP team meeting and provide written notice to certain individuals. |
|
|
|
|
|
|
Subd. 6 |
If a student is placed in a Department of Human Services or Department of Corrections facility for more than 15 days, the providing district must write an exit report and send it to the parent, resident district, and next serving district when the child leaves the facility. |
|
|
|
|
|
125A.56 |
Subd. 1(a)* |
Before a student is referred for a special education evaluation, the district must conduct and document at least two instructional intervention strategies. |
(continued on next page)
Exhibit B.1: Documentation Requirements Specific to Minnesota, 2012
(continued)
|
MN Statute or Rule Number |
Subdivision or Subpart |
Description
of Minnesota Documentation Requirements |
|
|
|
|
|
125A.58 |
Subd. 1* |
If a student's new serving district requests to purchase assistive technology for the child from the former serving district, the former district must respond in writing. |
|
|
|
|
|
125A.60 |
(no subdivisions)+ |
The commissioner of education must develop guidelines for the sale of used assistive technology, including a purchase agreement, a formula for establishing the sale price, and other terms and conditions of the sale. |
|
|
|
|
|
125A.75 |
Subd. 9(a)* |
Districts must give the commissioner of education an annual report on special education litigation costs. |
|
|
|
|
|
|
Subd. 9(b)+ |
The commissioner of education must report district special education litigation costs to the Legislature. |
|
|
|
|
|
127A.065 |
(no subdivisions)+ |
The commissioner of education must submit an annual report to the legislative committees on district cross subsidies. |
|
|
|
|
|
Rule |
|
|
|
|
|
|
|
3525.1100 |
Subp. 2B(1) and C* |
The total special education system document outlined in this rule satisfies the federal requirement for a plan outlined in 20 U.S. Code, sec. 1413(a), and 34 CFR 300.200. This plan must provide assurance the local education agency complies with several federal requirements. Minnesota, however, requires additional information in the document. |
|
|
|
|
|
3525.2325 |
Subp. 4* |
When a student is placed in a care-and-treatment facility and receives an evaluation or special education for 15 or more school days, the district providing the education must prepare an exit report. |
|
|
|
|
|
3525.2710 |
Subp. 3C(6) and 6* |
Non-federally mandated information is required in the evaluation report. |
|
|
|
|
|
|
Subp. 4F* |
Before a district can use conditional procedures, the IEP team must conduct a functional behavioral assessment. |
|
|
|
|
|
3525.2810 |
Subp. 1A(2)* |
Federal law requires that the IEP include short-term objectives only for students who take alternate assessments while this Minnesota rule requires short-term objectives in all students' IEPs. |
|
|
|
|
|
|
Subp. 1A(10)* |
IEPs must include a statement of students' need for and specific responsibilities of paraprofessionals. |
|
|
|
|
|
3525.2900 |
Subp. 4B* |
Secondary transition evaluation results must be documented as part of an evaluation report. |
|
|
|
|
|
3525.3600 |
C* |
The district must include information in the prior written notice on requesting a conciliation conference if the parent objects to district proposals regarding placement, identification, evaluation, or the provision of a free appropriate public education. |
|
|
|
|
|
3525.3900 |
Subps. 2C and E and 3H* |
Parents' and districts' requests for hearings must contain information not required by federal law. |
|
|
|
|
|
|
Subp. 4F* |
The basic procedures and safeguards notice must include information not required by federal law. |
|
|
|
|
|
3525.4010 |
Subp. 3+ |
MDE must collect and maintain data on participant evaluations of the due process hearing process and outcome. |
|
|
|
|
|
3525.4110 |
Subp. 1 |
The hearing officer must create a written verbatim record of the prehearing conference. |
(continued on next page)
Exhibit B.1: Documentation Requirements Specific to Minnesota, 2012
(continued)
|
MN Statute or Rule Number |
Subdivision or Subpart |
Description
of Minnesota Documentation Requirements |
|
|
|
|
|
3525.4420 |
(no subparts) |
While federal law indicates the hearing officer must make a written final decision and share it with parties, it does not stipulate details that need to be contained in the document, as does this Minnesota rule. |
|
|
|
|
|
3525.4750 |
Subp. 3* |
When districts propose that an interim placement continue longer than 45 days, they must provide parents with a written statement of reasons for the proposal. |
|
|
|
|
|
3525.4770 |
Subp. 1 |
Minnesota requires additional information in the request for an expedited hearing beyond that required by federal rules. |
NOTES: An * indicates a responsibility of school district staff. A + indicates a responsibility of the commissioner or staff of the Minnesota Department of Education.
SOURCES: Office of the Legislative Auditor, analysis of Minnesota statutes and rules and the federal Individuals with Disabilities Education Act and related regulations.
Exhibit B.2: Committee Requirements Specific to Minnesota, 2012
|
MN Statute Number |
Subdivision |
Description
of Minnesota Committee Requirements |
|
|
|
|
|
125A.023 |
Subd. 4 |
Minnesota establishes the State Interagency Committee, which may act as the federally required "mechanism for interagency coordination," so its existence may not be considered above what is required by federal law. However, the committee has responsibilities, such as developing an evaluation process to measure the success of state and local interagency efforts, which are not required by federal law. |
|
|
|
|
|
125A.027 |
Subds. 1 through 4* |
Interagency early intervention committees are required to, among other things, identify and assist in removing barriers to local service coordination and evaluate the success of local interagency efforts to improve quality and coordination of services. |
|
|
|
|
|
125A.22 |
(2) through (6)* |
This statute establishes a requirement for community transition interagency committees. Federal law requires that states have a coordinated set of activities for transition services but does not require that districts establish a committee to do the coordinating. Other than identifying transition services and programs, the responsibilities of these committees exceed federal requirements. |
|
|
|
|
|
125A.24 |
(no subdivisions)* |
School districts must form parent advisory councils that must meet at least yearly. |
NOTES: An * indicates a responsibility of school district staff.
SOURCES: Office of the Legislative Auditor, analysis of Minnesota statutes and rules and the federal Individuals with Disabilities Education Act and related regulations.
Exhibit B.3: Staffing Requirements Specific to Minnesota, 2012
|
MN Statute or Rule Number |
Subdivision or Subpart |
Description
of Minnesota Staff Requirements |
|
|
|
|
|
Statute |
|
|
|
|
|
|
|
125A.091 |
Subd. 11+ |
Facilitated individualized education program (IEP) team meetings are not mandated by federal law; "impartial state-provided facilitators" are additional staff required by Minnesota law for such meetings. |
|
|
|
|
|
Rule |
|
|
|
|
|
|
|
3525.0210 |
Subp. 20+ |
The definition of a facilitated IEP team meeting requires an impartial state-provided facilitator. |
|
|
|
|
|
3525.2340 |
Subp. 4* |
Caseloads are limited for special education teachers when students spend 50 percent or more of the school day receiving special instruction. |
|
|
|
|
|
3525.2405 |
Subp. 1* |
School districts must hire a special education director. |
NOTES: An * indicates a responsibility of school district staff. A + indicates a responsibility of the commissioner or staff of the Minnesota Department of Education.
SOURCES: Office of the Legislative Auditor, analysis of Minnesota statutes and rules and the federal Individuals with Disabilities Education Act and related regulations.
Exhibit B.4: Dispute Resolution Requirements Specific to Minnesota, 2012
|
MN Statute or Rule Number |
Subdivision or Subpart |
Description of Minnesota Dispute Resolution
Requirements |
|
|
|
|
|
Statute |
|
|
|
|
|
|
|
125A.091 |
Subd. 7* |
Parents must have the opportunity to meet with school district staff in a conciliation conference if parents object to proposals in their child's individualized education program (IEP). |
|
|
|
|
|
|
Subd. 8* |
Districts must offer and inform parents about voluntary dispute resolution processes (conciliation conferences and facilitated IEP meetings) that are not federally mandated. |
|
|
|
|
|
|
Subd. 10* |
Parties may request an additional mediation to resolve disputes over implementing the agreement reached in an initial mediation. |
|
|
|
|
|
|
Subd. 11*,+ |
Parents or school districts may choose to have an IEP team meeting facilitated by an impartial state-provided facilitator to assist in developing the IEP. |
|
|
|
|
|
|
Subd. 15* |
Hearing officers must hold a prehearing conference in which they identify the questions that must be answered to resolve the dispute and set a scheduling order for the hearing, among other duties. |
|
|
|
|
|
|
Subd. 16 |
The burden of proof at the due process hearing is on the party that presented the complaint. |
|
|
|
|
|
|
Subd. 18 |
Hearing officers have responsibilities that are not specified in federal law. |
|
|
|
|
|
|
Subd. 25+ |
The commissioner of education must monitor final hearing officer decisions and ensure enforcement of hearing officer decisions. |
(continued on next page)
Exhibit B.4: Dispute Resolution Requirements Specific to Minnesota, 2012
(continued)
|
MN Statute or Rule Number |
Subdivision or Subpart |
Description
of Minnesota Dispute Resolution Requirements |
|
|
|
|
|
Rule |
|
|
|
|
|
|
|
3525.0210 |
Subp. 8* |
A district staff person must attend conciliation conferences. Conciliation conferences are not in federal law or regulations. |
|
|
|
|
|
3525.3700 |
Subp. 1* |
Parents must have the opportunity to meet with school district staff in a conciliation conference if parents object to district proposals. |
|
|
|
|
|
Subp. 3* |
If a parent refuses a conciliation conference and wants to move forward with a hearing, the district must inform parents of the procedure for doing so. |
|
|
|
|
|
|
3525.3750 |
(no subparts)* |
Districts must inform parents of other forms of alternative dispute resolution beyond mediation (which is federally required). |
|
|
|
|
|
3525.3900 |
Subp. 4F* |
The school district bears the burden of proof in a due process hearing.a |
|
|
|
|
|
3525.4010 |
Subps. 1 and 2 |
Minnesota's criteria for hearing officers are more detailed than federal criteria. |
|
|
|
|
|
3525.4110 |
Subps. 1 and 2* |
Hearing officers must hold a prehearing conference prior to due process hearings. Prehearing conferences are not in federal law or regulations. |
|
|
|
|
|
3525.4300 |
Subps. 1 through 7 |
Hearing officers have responsibilities that are not specified in federal law. |
|
|
|
|
|
3525.4320 |
Subps. 1 through 4 |
Federal rules do not define any rules of evidence (only that parties can present evidence), whereas Minnesota lays out detailed rules parties must follow. |
|
|
|
|
|
3525.4700 |
(no subparts)+ |
Parents may file a complaint with the Minnesota Department of Education (MDE) if the district does not implement a hearing officer's decision. MDE must monitor final hearing officer decisions and ensure they are enforced. |
|
|
|
|
|
3525.4770 |
Subp. 5* |
Parties to an expedited hearing must disclose evaluations they plan to use. |
|
|
|
|
|
|
Subp. 6* |
Hearing officers must hold a prehearing conference prior to expedited hearings. Prehearing conferences are not in federal law or regulations. |
NOTES: An * indicates a responsibility of school district staff. A + indicates a responsibility of the commissioner or staff of the Minnesota Department of Education.
a This rule is superseded by Minnesota Statutes 2012 125A.091, subd. 16, which gives responsibility for the burden of proof to the party seeking relief.
SOURCES: Office of the Legislative Auditor, analysis of Minnesota statutes and rules and the federal Individuals with Disabilities Education Act and related regulations.
Exhibit B.5: Meeting Requirements Specific to Minnesota, 2012
|
MN Statute or Rule Number |
Subdivision or Subpart |
Description
of Minnesota Meeting Requirements |
|
|
|
|
|
Statute |
|
|
|
|
|
|
|
121A.43 |
(a)* |
The individualized education program (IEP) team must meet if a student with an IEP is suspended for more than five consecutive or ten cumulative school days. |
|
|
|
|
|
121A.67 |
Subd. 2* |
The IEP team must meet if a student with an IEP is restrained or removed from the classroom or school by a peace officer at the request of school staff twice in a 30-day period. |
|
|
|
|
|
125A.0942 |
Subd. 2(c)* |
When restrictive procedures are used twice in 30 days on a student or a pattern of using restrictive procedures emerges and restrictive procedures are not part of the student's IEP or behavior intervention plan, the IEP team must meet. |
|
|
|
|
|
125A.515 |
Subd. 5(b)(1)* |
When a student with an IEP is placed in a residential facility run by the Department of Human Services or the Department of Corrections, the providing agency must hold an IEP team meeting to agree on continuing or modifying the child's current IEP. |
|
|
|
|
|
Rule |
|
|
|
|
|
|
|
3525.2325 |
Subp. 2* |
When a student with an IEP is placed in a short-term care-and-treatment program, the student’s home school must give the providing agency an oral review of IEP goals. The providing agency must contact parents to reach agreement about continuing or modifying the student’s IEP and hold an IEP team meeting if agreement is not reached. |
|
|
|
|
|
|
Subp. 3* |
When a student with an IEP is placed in a long-term care-and-treatment program, the education staff in the providing district must decide if the student’s current IEP can be implemented and contact the parents to reach agreement on the proposed services. If the district and parents cannot come to agreement, the district must hold an IEP team meeting as soon as possible. |
NOTE: An * indicates a responsibility of school district staff.
SOURCES: Office of the Legislative Auditor, analysis of Minnesota statutes and rules and the federal Individuals with Disabilities Education Act and related regulations.
Exhibit B.6: Timelines Specific to Minnesota, 2012
|
MN Statute or Rule Number |
Subdivision or Subpart |
Description of Minnesota Timeline Requirements |
|
|
|
|
|
Statute |
|
|
|
|
|
|
|
121A.43 |
(a)* |
The individualized education program (IEP) team must meet within ten days after a student’s sixth consecutive day of suspension or tenth cumulative day of suspension. Federal law does not require IEP teams to meet after a certain number of days of suspension unless the school proposes a change in educational placement. |
|
|
|
|
|
|
(c)* |
Federal law requires the provision of educational services to a student who has been suspended for ten cumulative school days or more. In Minnesota law, services are required after five consecutive school days of suspension. |
|
|
|
|
|
125A.091 |
Subd. 7* |
Districts must hold a conciliation conference within ten calendar days of receiving a parent’s objection to a proposal or refusal in a prior written notice. Conciliation conferences do not exist in federal law. |
|
|
|
|
|
|
Subd. 7* |
Within five school days after a conciliation conference is held, the district must serve parents with a written memo that describes the district’s final proposed offer of service. |
|
|
|
|
|
|
Subd. 24 |
Parties must appeal to the Minnesota Court of Appeals within 60 days of receiving a hearing officer's decision. Federal law does not set a time limit on appeals to an appeals court. |
|
|
|
|
|
125A.515 |
Subd. 4(a)* |
Education services must be provided to a student placed in a care-and-treatment facility within three business days of entering the facility. |
|
|
|
|
|
|
Subd. 5(a)* |
When a student is placed in a care-and-treatment facility, the district providing education must contact the resident district within one business day to find out if the student has been identified as having a disability. |
|
|
|
|
|
125A.58 |
Subd. 1* |
If a student's new serving district requests to purchase assistive technology for the student from the former serving district, the former district must respond in writing within 30 days. |
|
|
|
|
|
Rule |
|
|
|
|
|
|
|
3525.0210 |
Subp. 21 |
Minnesota’s definition of the word "filing" creates a timeline for transmitting documents. When documents arrive after 4:30 p.m. or on a weekend or holiday, they are counted as arriving the next business day. |
|
|
|
|
|
3525.2325 |
Subp. 1* |
Education services must be provided to any student who will be absent from the normal school site due to placement in a facility or the student's home for care and treatment for 15 consecutive school days or 15 intermittent school days for health-impaired students in need of special education. |
|
|
|
|
|
|
Subp. 2* |
Students placed in short-term care-and-treatment programs (less than 31 school days) must start receiving educational services immediately after enrollment. |
|
|
|
|
|
|
Subp. 3* |
Students placed in long-term care-and-treatment programs (more than 30 school days) must start receiving educational services immediately after enrollment. |
|
|
|
|
|
3525.2550 |
Subp. 2* |
Federal rules stipulate initial evaluations must be conducted within 60 days of receiving parental consent, whereas Minnesota allows only 30 school days to elapse. |
|
|
|
|
|
3525.3600 |
(no subparts)* |
School districts must serve parents with a prior written notice no less than 14 calendar days before an evaluation or a proposed change takes effect. Districts must inform parents that except for initial placement and provision of services, the district will proceed with the proposed placement and services unless the parents object in writing within 14 calendar days of receiving the notice. |
(continued on next page)
Exhibit B.6: Timelines Specific to Minnesota, 2012
(continued)
|
MN Statute or Rule Number |
Subdivision or Subpart |
Description
of Minnesota Timeline Requirements |
|
|
|
|
|
3525.3700 |
Subp. 1aA* |
A conciliation conference must be held within ten calendar days of parents' agreement or request to participate in one. |
|
|
|
|
|
Subp. 1aD* |
Within five business days after a conciliation conference is held, the district must serve parents with a written memo and IEP. |
|
|
|
|
|
|
Subp. 1aE* |
The district must proceed with actions described in the post-conciliation conference memo other than initial evaluation or initial placement ten business days after the conciliation conference memo is served, unless the parent objects in writing. |
|
|
|
|
|
|
3525.3900 |
Subp. 1*,+ |
A school district administrator receiving a request for a due process hearing must immediately file the request with the Minnesota Department of Education (MDE) and in no case more than two business days following receipt of the request. If the request for a due process hearing is filed directly with MDE, the department must notify the district of the request immediately and in no case more than two business days following receipt of the request. |
|
|
|
|
|
Subp. 1* |
When a district is notified of a due process hearing request, it must serve notice of basic procedures and safeguards for due process hearings on the parent within two business days. |
|
|
Subp. 5+ |
MDE must appoint a hearing officer within two business days of the date the hearing request was filed with the department. |
|
|
|
|
|
|
3525.4110 |
Subp. 1* |
A prehearing conference must be held within five business days of the date MDE appoints a hearing officer. Prehearing conferences are not required by federal law or regulations. |
|
|
|
|
|
3525.4350 |
Subp. 2 |
Any party that objects to a request for consolidation of due process hearing cases must file their objections within five calendar days following service of the request for consolidation. Federal law does not set standards for case consolidation. |
|
|
|
|
|
3525.4700 |
(no subparts) |
Parties must appeal to the Minnesota Court of Appeals within 60 calendar days of receiving a hearing officer's decision. Federal law does not set a time limit on appeals to an appeals court. |
|
|
|
|
|
3525.4750 |
Subp. 3* |
If a district proposes that an interim placement continue longer than 45 calendar days, it must provide parents with a written statement of reasons for the proposal. |
|
|
|
|
|
3525.4770 |
Subp. 3+ |
The commissioner of education must appoint a hearing officer for an expedited due process hearing within two business days of receipt of notice. |
|
|
|
|
|
|
Subp. 5 |
Parties in an expedited due process hearing must disclose all evaluations completed to date and recommendations that parties intend to use at the hearing at least three business days prior to the hearing. |
|
|
|
|
|
|
Subp. 6* |
A prehearing conference for an expedited due process hearing must be held within two business days of the date MDE appoints a hearing officer. Prehearing conferences are not present in federal law or regulations. |
|
|
|
|
|
|
Subp. 8 |
In Minnesota, the hearing officer must render a written decision ten calendar days from the date the expedited hearing was requested. In federal rule, the written decision is required ten days after the hearing. |
NOTES: An * indicates a responsibility of school district staff. A + indicates a responsibility of the commissioner or staff of the Minnesota Department of Education.
SOURCES: Office of the Legislative Auditor, analysis of Minnesota statutes and rules and the federal Individuals with Disabilities Education Act and related regulations.
Exhibit B.7: Miscellaneous Professional Responsibilities Specific to Minnesota, 2012
|
MN Statute or Rule Number |
Subdivision or Subpart |
Description of Miscellaneous Professional Responsibility Requirements in Minnesota that Exceed Federal Requirements |
|
|
|
|
|
Statute |
|
|
|
|
|
|
|
121A.61 |
Subd. 3(k), (l), and (q)* |
Federal law is concerned only with discipline when it constitutes a change in placement (which is ten consecutive days of suspension), as long as procedures are the same for students with and without disabilities. Minnesota law requires a discipline policy which includes certain components, including procedures for considering whether there is a need to review the individualized education program (IEP) when a student with a disability is removed from class, referral when appropriate to special education services, and coordination with county boards for crisis services. |
|
|
|
|
|
123A.07 |
(4)* |
Alternative learning centers must make recommendations for successful learning programs for students in special education that are placed in alternative settings. |
|
|
|
|
|
123B.90 |
Subd. 2(f)* |
Schools that provide transportation at public expense must make reasonable accommodations for school bus safety training for students with disabilities. |
|
|
|
|
|
125A.06 |
(d)* |
Braille instruction for visually impaired students must be sufficient to enable those students to communicate at the level of their peers. |
|
|
|
|
|
125A.08 |
(b)(1)* |
Federal law allows schools to use Medicaid to pay for services, while Minnesota law requires IEP teams to consider services covered by medical assistance while planning a student's IEP. |
|
|
|
|
|
125A.0942 |
Subds. 2(a) and 5(a)* |
Only certain licensed specialists and professionals with specified degrees who have completed specific training may use restrictive procedures. |
|
|
|
|
|
|
Subd. 2(b)* |
Schools must make a reasonable effort to notify parents the same day a restrictive procedure is used, or, if they are unable to do so, provide written notification within two days. |
|
|
|
|
|
|
Subd. 3(a)(3)* |
School staff must directly observe the student while physical holding or seclusion is being used. |
|
|
|
|
|
|
Subd. 3(a)(5) and (6)* |
If schools wish to use seclusion, they must build a room to specifications detailed in this statute and certify the room with the commissioner of education; local authorities must certify the room complies with building and safety codes. |
|
|
|
|
|
|
Subd. 3(a)(7)(v)* |
Prior to using prone restraints, a district must review any known medical or psychological limitations that may contraindicate the use of prone restraints. |
|
|
|
|
|
|
Subd. 3(a)(7)+ |
Minnesota’s Department of Education (MDE) must collect data on the use of prone restraints and publish the data on the use of prone restraints on their Web site. |
|
|
|
|
|
125A.21 |
Subd. 2* |
Federal law allows public agencies to seek reimbursement from insurers or other third parties, while Minnesota law requires that districts seek reimbursement. |
|
125A.515 |
Subd. 1+ |
The commissioner of education must approve on-site education programs run by the Department of Human Services and the Department of Corrections. |
|
|
|
|
|
125A.52 |
Subd. 1 |
The Department of Human Services and Department of Corrections must use an educational screening tool to screen each juvenile who is held for at least 72 hours, unless the facility knows the student has an IEP and obtains a copy. |
|
|
|
|
|
125A.53 |
(no subdivisions) |
The governing boards of special education cooperatives have the responsibility for choosing the cooperative's special education director. |
|
|
|
|
|
127A.11 |
(no subdivisions)+ |
The commissioner of education, in cooperation with the commissioner of human services, must monitor costs of health-related special education services provided by public schools. |
(continued on next page)
Exhibit B.7: Miscellaneous Professional Responsibilities Specific to Minnesota, 2012
(continued)
|
MN Statute or Rule Number |
Subdivision or Subpart |
Description of Miscellaneous Professional Responsibility Requirements in Minnesota that Exceed Federal Requirements |
|
|
|
|
|
Rule |
|
|
|
|
|
|
|
3525.0550 |
(no subparts)* |
Districts must assign each child an IEP manager to coordinate special education services. |
|
|
|
|
|
3525.0850 |
(no subparts)* |
Federal rule requires IEP teams to consider behavioral interventions and districts to provide psychological services, but state provisions additionally require districts to "focus on skill acquisition rather than merely behavior reduction or elimination." |
|
|
|
|
|
3525.2325 |
Subp. 2* |
When a student with an IEP is placed in a short-term care-and-treatment program, the student’s home district must give the providing agency an oral review of the IEP goals and services provided. The providing district must contact the child’s parents about, and reach agreement on, continuing or modifying the student’s IEP and call an IEP team meeting if agreement on the IEP is not reached. If the providing district cannot determine whether a student has been identified with a disability, it must screen the student to determine academic, social, and behavioral needs. |
|
|
|
|
|
|
Subp. 3* |
When a student with an IEP is placed in a long-term care-and-treatment program, the providing district must decide if the student’s current IEP can be implemented and contact the student’s parents to reach agreement on continuing special education services. If agreement cannot be reached, the providing district must hold an IEP team meeting as soon as possible. |
|
|
|
|
|
Subp. 5 |
Minnesota sets minimum standards for instruction for students in care-and-treatment facilities. |
|
|
|
|
|
|
3525.2350 |
Subp. 3* |
An IEP team member licensed in the student's disability must conduct that student’s evaluations. |
|
|
|
|
|
3525.2450 |
(no subparts) |
School boards may remove a surrogate parent by majority vote. State rules stipulate a procedure for doing so. |
|
|
|
|
|
3525.2710 |
Subp. 4F* |
The IEP team must conduct a functional behavioral assessment before using any conditional procedures. |
|
|
|
|
|
3525.3600 |
C* |
Districts must provide parents with a copy of the IEP any time they propose revising it, whereas in federal law they need to provide it only upon request. |
NOTES: An * indicates a responsibility of school district staff. A + indicates a responsibility of the commissioner or staff of the Minnesota Department of Education.
SOURCES: Office of the Legislative Auditor, analysis of Minnesota statutes and rules and the federal Individuals with Disabilities Education Act and related regulations.
Exhibit B.8: Student Eligibility and Services Requirements Specific to Minnesota, 2012
|
MN Statute or Rule Number |
Subdivision or Subpart |
Description of Minnesota Student Eligibility Requirements and Requirements for Services that Exceed Federal Requirements |
|
|
|
|
|
Statute |
|
|
|
|
|
|
|
121A.43 |
(c)* |
Federal law requires the provision of educational services to a student who has been suspended for ten cumulative school days or more; in state law, services are required after five consecutive school days of suspension. |
|
|
|
|
|
125A.02 |
Subd. 1a |
Federal law states a child with a disability may include children experiencing developmental delays beginning at age three, while in Minnesota it includes children beginning at birth. |
|
|
|
|
|
125A.03 |
(a) and (b) |
Minnesota law stipulates special instruction and services must be provided for all children with a disability, from birth until July 1 after the child turns 21. The Individuals with Disabilities Education Improvement Act, part B, includes only children between the ages of 3 and 21, inclusive. |
|
|
|
|
|
125A.06 |
(b)(2) |
Minnesota's definition of "blind student" includes students who have a medically indicated expectation of visual deterioration, while the federal definition does not. |
|
|
|
|
|
125A.08 |
(b)(1)* |
In Minnesota law, IEPs must address students' needs for transition from secondary services to postsecondary education and training, employment, community participation, recreation, and leisure and home living during grade 9. In federal law, transition services must be considered at age 16. |
|
|
|
|
|
|
(b)(2) |
Under part B of the Individuals with Disabilities Education Improvement Act, children become eligible for special education at age 3; this Minnesota law states that children under the age of 5 must be provided special education. |
|
|
|
|
|
125A.18 |
(no subdivisions) |
Federal rule states parentally placed private school students do not have an individual right to receive the special education and related services they would receive if they attended a public school. Minnesota law says instruction and service cannot be denied to a student in private school and stipulates transportation must be provided. Federal law gives private school students access to due process only for issues related to child find, while Minnesota law does not restrict such access. |
|
|
|
|
|
125A.56 |
Subd. 1* |
Before a child is referred for a special education eligibility assessment, the district must conduct and document two instructional intervention strategies while the student is in the general classroom. |
|
|
|
|
|
Rule |
|
|
|
|
|
|
|
3525.0300 |
(no subparts) |
This Minnesota rule does not restrict ages of students eligible for special education, while the Individuals with Disabilities Education Improvement Act, part B, defines eligible students as between the ages of 3 and 21. |
|
|
|
|
|
3525.0755 |
Subps. 3, 4, and 5* |
Provision of extended year services are required by federal law if necessary to provide a free and appropriate public education. Federal law does not require that states have a process for determining the need; rather, it says need should be determined on an individual basis. Therefore, Minnesota’s mandated criteria for determination, sources of information for IEP team determination, and other factors exceed federal requirements. |
|
|
|
|
|
3525.1325 |
Subp. 1 |
The Minnesota definition for autism spectrum disorders includes disorders that adversely affect a pupil's functioning, while federal rule specifies the disability must adversely affect educational performance. In addition, the Minnesota definition notes the features of the disability may vary widely and range in severity. |
|
|
|
|
|
3525.1329 |
Subp. 1 |
Minnesota's definition of emotional or behavioral disorders is more expansive than the federal definition, and includes anxiety, aggression, impulsivity, and other "behavioral responses." |
(continued on next page)
Exhibit B.8: Student Eligibility and Services Requirements Specific to Minnesota, 2012
(continued)
|
MN Statute or Rule Number |
Subdivision or Subpart |
Description of Minnesota Student Eligibility Requirements and Requirements for Services that Exceed Federal Requirements |
|
|
|
|
|
3525.1331 |
Subp. 1 |
Minnesota's definition for deaf and hard of hearing includes hearing loss with the potential to affect education, communication, and social functioning. The federal definition stipulates only that the hearing loss must adversely affect a child's educational performance. |
|
|
|
|
|
3525.1337 |
Subp. 1 |
Minnesota's definition for physically impaired includes physical impairments that adversely affect physical or academic functioning, while the federal definition accounts only for adverse effects to educational performance. |
|
|
|
|
|
3525.1339 |
Subp. 1 |
The federal definition equivalent to Minnesota’s category of severely multiply impaired includes children with “concomitant impairments…which cause such severe education needs that they cannot be accommodated in special education programs solely for one of the impairments.” Minnesota’s definition does not impose this requirement, simply stating children are eligible if they have “severe learning and developmental problems resulting from two or more disability conditions.” |
|
|
|
|
|
3525.1341 |
Subp. 1 |
Minnesota's definition of specific learning disability is much lengthier than the federal definition and expands on the way the disorder is manifested and demonstrated. |
|
|
|
|
|
3525.1343 |
Subps. 1 through 4 |
Minnesota defines four disorders within speech or language impairments, which are not defined in the federal definition. |
|
|
|
|
|
3525.1345 |
Subp. 1 |
Minnesota's definition for visually impaired includes a limitation in sight that interferes with acquiring information or interaction with the environment, while the federal definition includes only an impairment that affects educational development. |
|
|
|
|
|
3525.1348 |
Subp. 1 |
Minnesota's definition of traumatic brain injury includes impairments that "may" affect a child's educational performance and "may" result in the need for special education, while the federal definition does not use this modifier that could include children with the potential (rather than current) need for services. |
|
|
|
|
|
3525.1352 |
Subp. 2 |
Federal law says special physical education services must be provided to a student when prescribed in a student's IEP, but it does not require states to develop eligibility criteria for the services. Minnesota rules set criteria for determining whether a child is eligible for developmentally adapted physical education. |
|
|
|
|
|
3525.1354 |
Subp. 1 |
Minnesota allows evaluation teams to determine a child has a disability and is in need of special education even though the child does not meet specific criteria in Minnesota rules. |
|
|
|
|
|
3525.1400 |
(no subparts)* |
Federal law requires that students with disabilities be educated to the extent possible with their non-disabled peers, but does not say the classrooms and facilities for special education should be equivalent to general education, as does this Minnesota rule. |
|
|
|
|
|
3525.2810 |
Subp. 1A(7)* |
In Minnesota, transition planning must begin at age 14 instead of the federally mandated age 16. |
|
|
|
|
|
3525.2900 |
Subp. 4* |
This Minnesota rule states transition planning must begin in grade 9 or age 14, whichever comes first. Federal law requires that transition planning begin at age 16. |
|
|
|
|
|
3525.3100 |
(no subparts)* |
In Minnesota, children who are discontinued from all special education services may be reinstated within 12 months without documenting two prereferral interventions or conducting a new evaluation if (1) the child has had an evaluation in the past three years and (2) there are data on the child's present levels of performance. |
NOTES: The requirements in this table pertain to school districts’ determination of which students are eligible for special education and what services students are eligible to receive. An * indicates a responsibility of school district staff.
SOURCES: Office of the Legislative Auditor, analysis of Minnesota statutes and rules and the federal Individuals with Disabilities Education Act and related regulations.
[1] In addition, we excluded 20 U.S. Code, secs. 1450-1482 (2004), because they pertain to competitive grants, cooperative agreements, and contracts for activities to improve education for students with disabilities, as well as activities of the secretary of the U.S. Department of Education.
[Minnesota Department of Education (MDE) Response]
February 22, 2013
Mr. James Nobles
Office of the Legislative Auditor
Room 140 Centennial Building
638 Cedar Street
St. Paul, MN 55155
Dear Mr. Nobles:
Thank you for the Office of the Legislative Auditor’s (OLA) program report “Special Education.” The Minnesota Department of Education (MDE) appreciates your auditors’ evaluation of this complex and critical program. MDE commends the auditors who conducted the research, summarized the findings, and produced a valuable, fair and comprehensive report. MDE has considered the recommendations and information contained in this report and offers specific support, as indicated below.
Recommendation #1
The Legislature should consider options to reduce school district reliance on general education funding to pay special education expenses. At the same time, MDE should work with school districts to identify feasible cost controls in special education.
MDE agrees with this recommendation. The Governor has recommended an increase in state special education aid of $125 million for FY 2015 and $326 million for the FY 2016-2017 biennium, which would reduce the average special education cross subsidy by $180 per student. The Governor has also recommended significant reform of the special education funding formula that will target the cross subsidy reduction to districts with the greatest need, and strengthen incentives for cost control by allocating a portion of aid based on student enrollment and requiring cost sharing between the resident school district and the serving district or charter school.
Recommendation #2
The Legislature should direct MDE to initiate independent analyses of the economic and educational impacts of potential changes to state regulations.
MDE agrees that, simultaneously with implementing Recommendation 5 and 6, MDE should review state regulations in order to align them with the goals of decreasing paperwork and increasing student outcomes. The OLA report provides an independent starting point for this project and MDE will consider their options regarding this recommendation.
Recommendation #3
The Legislature should consider modifying laws that require resident school districts to pay special education costs of students who choose to enroll outside the district where they reside.
MDE agrees with this recommendation. The Governor has recommended a system of cost sharing between the resident school district and the nonresident serving district or charter school, in which the resident district would be responsible for 90 percent of special education costs not covered by state or federal aid, and the nonresident serving district or charter school would be responsible for 10 percent of special education costs not covered by state or federal aid.
Recommendation #4
MDE should evaluate its monitoring process to identify ways to improve special education teachers’ understanding of compliance requirements.
MDE agrees with this recommendation. MDE has recently made considerable efforts to provide statewide onsite training and online training materials. MDE has identified ensuring the availability of training to special education teachers as a priority. MDE concurs that direct training and technical assistance to providers results in increased understanding of the compliance requirements, and notes that leadership organizations have also expressed a desire for increased access to training and technical assistance. MDE continues to look for ways to partner with other and local education agencies to make sure that teachers can access its training. MDE intends to access the Regional Centers of Excellence to further this goal.
Recommendation #5
MDE should continue its efforts to streamline paperwork required in special education and identify effective practices from districts to encourage additional efficiencies.
MDE agrees with this recommendation. As the report notes, MDE has made efforts to alleviate special education paperwork. To further this effort, the Governor’s budget includes a proposal that would allow MDE to create and provide online forms at no charge to users. These forms would ask LEAs to report only required information and would build in ease and efficiency for teachers.
Recommendation #6
MDE should update its special education rules for consistency with Minnesota Statutes.
MDE agrees with this recommendation. MDE will need to seek rulemaking authority in order to carry out this recommendation.
Again, MDE appreciates the thorough and comprehensive picture of the current state of special education funding and services in Minnesota. I am hopeful that this document will guide policy makers in addressing this critical area of our education system in order to help us fulfill our goals of providing a high quality education to every Minnesota student so that all can reach their highest potential.
Sincerely,
Dr. Brenda Cassellius
Commissioner
BC/pkh
[End Minnesota Department of Education (MDE) Response]
Forthcoming Evaluations
Medical Assistance Payment Rates for Dental Services, March 2013
Recent Evaluations
Agriculture
“Green Acres” and Agricultural Land Preservation Programs, February 2008
Pesticide Regulation, March 2006
Criminal Justice
Law Enforcement’s Use of State Databases, February 2013
Public Defender System, February 2010
MINNCOR Industries, February 2009
Substance Abuse Treatment, February 2006
Community Supervision of Sex Offenders, January 2005
CriMNet, March 2004
Education, K-12, and Preschool
Special Education, March 2013
K-12 Online Learning, September 2011
Alternative Education Programs, February 2010
Q Comp: Quality Compensation for Teachers,
February 2009
Charter Schools, June 2008
School District Student Transportation, January 2008
Education, Postsecondary
Preventive Maintenance for University of Minnesota Buildings, June 2012
MnSCU System Office, February 2010
MnSCU Occupational Programs, March 2009
Compensation at the University of Minnesota, February 2004
Energy
Renewable Energy Development Fund, October 2010
Biofuel Policies and Programs, April 2009
Energy Conservation Improvement Program, January 2005
Environment and Natural Resources
Conservation Easements, February 2013
Environmental Review and Permitting, March 2011
Natural Resource Land, March 2010
Watershed Management, January 2007
Financial Institutions, Insurance, and Regulated Industries
Liquor Regulation, March 2006
Directory of Regulated Occupations in Minnesota,
February 1999
Occupational Regulation, February 1999
Government Operations
Helping Communities Recover from Natural Disasters, March 2012
Fiscal Notes, February 2012
Capitol Complex Security, May 2009
County Veterans Service Offices, January 2008
Pensions for Volunteer Firefighters, January 2007
Postemployment Benefits for Public Employees,
January 2007
Health
Financial Management of Health Care Programs,
February 2008
Nursing Home Inspections, February 2005
MinnesotaCare, January 2003
Human Services
State-Operated Human Services, February 2013
Child Protection Screening, February 2012
Civil Commitment of Sex Offenders, March 2011
Medical Nonemergency Transportation, February 2011
Personal Care Assistance, January 2009
Human Services Administration, January 2007
Public Health Care Eligibility Determination for Noncitizens, April 2006
Housing and Local Government
Consolidation of Local Governments, April 2012
Preserving Housing: A Best Practices Review, April 2003
Managing Local Government Computer Systems: A Best Practices Review, April 2002
Local E-Government: A Best Practices Review, April 2002
Affordable Housing, January 2001
Jobs, Training, and Labor
Workforce Programs, February 2010
E-Verify, June 2009
Oversight of Workers’ Compensation, February 2009
JOBZ Program, February 2008
Misclassification of Employees as Independent Contractors, November 2007
Prevailing Wages, February 2007
Miscellaneous
The Legacy Amendment, November 2011
Public Libraries, March 2010
Economic Impact of Immigrants, May 2006
Gambling Regulation and Oversight, January 2005
Minnesota State Lottery, February 2004
Transportation
Governance of Transit in the Twin Cities Region,
January 2011
State Highways and Bridges, February 2008
Metropolitan Airports Commission, January 2003
Evaluation reports can be obtained free of charge from the Legislative Auditor’s Office, Program Evaluation Division,
Room 140 Centennial Building, 658 Cedar Street, Saint Paul, Minnesota 55155, 651-296-4708. Full text versions of recent reports are also available at the OLA Web site: http://www.auditor.leg.state.mn.us